Design and Integration of
Suspension, Brake and Steering Systems
for a Formula SAE Race Car
Final Report
Mark Holveck ’01
Rodolphe Poussot ’00
Harris Yong ’00
Submitted to the Department of Mechanical and Aerospace Engineering, Princeton University in partial fulfillment of the requirements of Undergraduate Independent Work.
Advisor: Prof. Seymour Bogdonoff
Reader: Prof. Jeremy Kasdin
MAE 340/440
67 pages
The authors would like to give special thanks to:
The Mechanical and Aerospace Engineering Department at Princeton University, for encouraging the Formula SAE project and for their financial support.
Jim Arentz at Penske Racing Shocks, for the prompt design of suitable adjustable dampers.
Professor Seymour Bogdonoff at Princeton University, for his advice on the direction of the Formula SAE team, his focus on the larger picture of car design and pointing out the necessity of sensitivity analysis.
Scott Badenoch at Delphi Chassis, for his insights on suspension design of Formula SAE cars.
Rich Cervone at Cervone’s Competition Karts for supplying high quality brake products and for his design help.
Chassis Shop Performance Products, in supplying a variety of components at discounted prices.
Dave Cook at Cal Poly Pomona for help on a variety of design decisions.
Steve Dalstrom at TrueChoice Motorsports, for assisting us in hardware selection.
Roy Dean at Lehigh University for help on a variety of design decisions.
Lawrence Gunn at Reynard Motorsport, for providing us with free versions of the Reynard Kinematics suspension geometry software.
Hyperco High Performance Products for supplying coil springs at discounted prices.
AJ Jones and Chris Joehenning at Goodyear Tire & Rubber, for comprehensive tire performance data.
Professor Jeremy Kasdin at Princeton University, for keeping in constant contact with the authors and for keeping us on schedule.
John McCrory at Aurora Bearing for supplying rod ends ahead of promised ship dates.
Arron Melvin at Princeton University for assisting in all aspects of design and parts sourcing and for acting as an active member of the Princeton Formula SAE Vehicle Control Division.
Glenn Northey at Princeton University, for invaluable manufacturing and design advice.
Rodney Sparks at California State University, Sacramento, for the suggestions on suspension kinematics, packaging and hardware.
Jeff Speer at Hoosier Racing Tire for providing helpful tire information and for supplying tires at discounted prices
Graham Templeman from the UK in working together on the numerical calculations regarding on suspension , brake and steering systems.
Christopher Yanchar at General Motors Vehicle Dynamics, for sharing his experiences and knowledge gained by being a member of the University of Minnesota Formula SAE experience team.
Simulating and Prototyping a Formula SAE Race Car Suspension System
This paper is meant to supplement "Simulating and Prototyping a Formula SAE Race Car Suspension System," submitted on January 5, 2000 and will not contain some of the background information and details which led to the current suspension design. The appendix on vehicle control systems on page
* may be helpful to those who are not familiar with suspensions system basics.Princeton University MAE Undergraduate Independent Work
This paper is meant to be the final report for the 1999-2000 MAE undergraduate work requirement and outlines the work performed by the Princeton Formula SAE Vehicle Division, which is responsible for the suspension, wheel, tire, brake and steering systems of the Formula SAE car.
The suspension, brake and steering systems is often described in this paper as the "vehicle control systems."
Because of the wealth of information accrued over the past several months, it is impossible to reference every fact, especially those acquired from non-standard literature, such as electronic resources, contact with professionals, etc. An effort has been made, however, to give credit to sources providing unique information. The more well known and generic suspension design criteria and definitions cited have their references given on page
*, along with sources that the authors consulted but whose works are not quoted directly.Use of the US Customary System
Although the authors were planning to use SI units as much as possible, the facilities in the student machine shop and most of the acquired parts were non-SI. Thus, much of the data presented in this report are in the US Customary System. The kinematics of the suspension system, however, was designed in SI and then converted to the US Customary System prior to manufacture.
Acknowledgements
*Prefaces
*Simulating and Prototyping a Formula SAE Race Car Suspension System
*Princeton University MAE Undergraduate Independent Work
*Vehicle Control Systems
*References
*Use of the US Customary System
*Table of Contents
*List of Figures and Tables and Symbols
*Abstract
*Introduction
*Defining the Vehicle Control Systems
*Philosophy and Goals in the Context of Formula SAE
*Basic Assumptions and Estimates
*The Vehicle Control Systems
*The Suspension System
*Design Overview
*Table of Suspension System Specifications
*Design Procedure
*Revisions to Suspension Kinematics
*Revisions to Suspension Dynamics
*Reynard Kinematics Schematics
*Suspension Components and Manufacturing Details
*Suggestions for Future Iterations
*The Steering System
*Design Overview
*Table of Steering System Specifications
*Important Steering System Parameters
*Steering Components and Manufacturing Details
*Suggestions for Future Iterations
*The Brake System
*Design Overview
*Table of Brake System Specifications
*Important Brake System Parameters
*Brake System Components and Manufacturing Details
*Suggestions for Future Iterations
*CONCLUSION
*References
*Appendices
*Vehicle Control Systems Definitions
*Reynard Kinematic Points for the Front Suspension
*Reynard Kinematic Points for the Rear Suspension
*Vehicle Dynamics Calculations Spreadsheet
*Brake System Calculations Spreadsheet
*Penske 8750 Damper Dyno Plots
*A-Arm Dimensions
*Goodyear Tire Curves
*List of Figures and Tables and Symbols
Figure 1. The University of Leeds Formula SAE car. (Formula SAE 1999 brochure) 4
Figure 2. The Princeton Formula SAE car in April 2000. 4
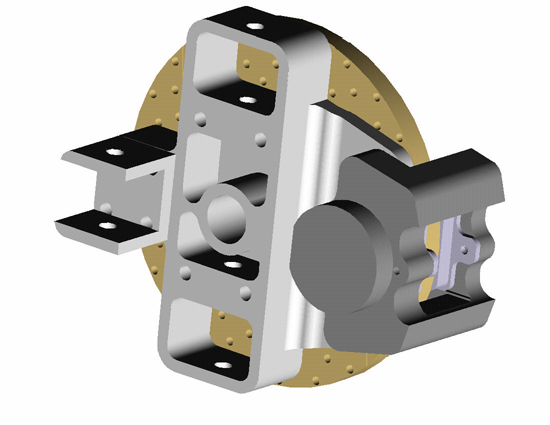
Figure 3. A solid Pro-Engineer view of the front left upright, hub and brake assembly. 7
Figure 4. A schematic displaying the important suspension and steering pickup points. Shown is a left view viewed from outside the car. 7
Figure 5. A semi-assembled front right suspension and steering system. 8
Figure 6. A top view of the same front right suspension system showing the brakes as well. 8
Figure 7. Inboard view of the rear right suspension assembly without the spring/damper unit. 8
Figure 8. Solid view of the uprights. Front left to right: Rear right upright (inboard view), rear right upright (outboard view), front left upright (inboard view), front left upright (outboard view). 9
Figure 9. The uprights and control arms of the January prototype. Left figure shows the inside view of the rear left system. Right figure shows the inboard view of the front left system. 9
Figure 10. Suspension camber curves. 12
Figure 11. Caster induced camber for the steering front wheels. 13
Figure 12. Front suspension roll center characteristics as a function of body roll. 14
Figure 13. Rear suspension roll center characteristics as a function of body roll. 14
Figure 14. Reynard Kinematics schematic of the front suspension system, viewed from the front left of the car. 18
Figure 15. Reynard Kinematics schematic of the rear suspension system, viewed from the front left of the car. 18
Figure 16. The front hub. Left figure shows the outboard view and the holes for the wheel studs. RIght figure shows the inboard view with the holes for the brake rotor. 19
Figure 17. The rear hub, a Volkswagen product, seen from inside a wheel. The hub comes with female splines to fit the outboard constant velocity joint. 19
Figure 18. The steering ssytem including the rack, supports and "z-links." 23
Figure 19. An overhead view of the front axle including the steering system. 23
Figure 20. Steering angle response shown by comparing the average front wheel steering angle with the steering wheel angle. 25
Figure 21. Overall steering ratio. This is the slope of Figure 20. 25
Figure 22. Front left suspension bump steer curve. Negative toe is toe-in. 26
Figure 23. Rear left suspension bump steer curve. Negative toe is toe-in. 27
Figure 24. The Ackermann steering characteristics (theoretical vs. the Princeton Formula SAE car's steering). 28
Figure 25. This view of the car clearly shows the Ackermann steering effect that causes the inside wheel to steer more than the outside wheel. 29
Figure 26. A Stiletto steering rack similar to the one used on the Princeton Formula SAE car. 31
Figure 27. The "z-link" extension connecting the steering rack and a track rod. 31
Figure 28. Steering side and center mounts. 31
Figure 29. The Alpha steering wheel from cockpit view. 32
Figure 30. Modular front outer steering track rod attachment to the front upright can be changed to alter steering characteristics without remanufacturing the entire upright. 32
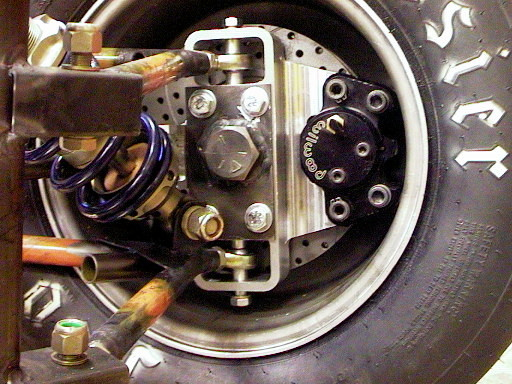
Figure 31. Front right brake system, shown with a modified Wilwood caliper, the rotor, as well as the hub assebly over the spindle bolt. 34
Figure 32. The rear rotor. 39
Figure 33. Wilwood pedal assembly, shown with dual master cylinder and balance bar. 40
Figure 34. Suspension and steering geometry. (Milliken) 46
Figure 35. One possible orientation for rear steer Ackermann steering. (Milliken) 46
Figure 36. Basic tire/wheel orientations. (Milliken) 48
Figure 37. Track rod being too short causes toe changes (bump steer). (Milliken) 48
Figure 38. Track rod in wrong location causes toe changes (bump steer). (Milliken) 48
Figure 39. Coordinates for the front suspension system. 54
Figure 40. Coordinates for the rear suspension system. 54
Figure 41. Spreadsheet showing the calculation of vehicle dynamics parameters. 55
Figure 42. Spreadsheet showing calculations of brake system parameters. 56
Figure 43. Front damper dyno plot. 57
Figure 44. Rear damper dyno plot. 58
Figure 45. Front suspension A-arm dimensions. 59
Figure 46. Rear suspension A-arm dimensions. 60
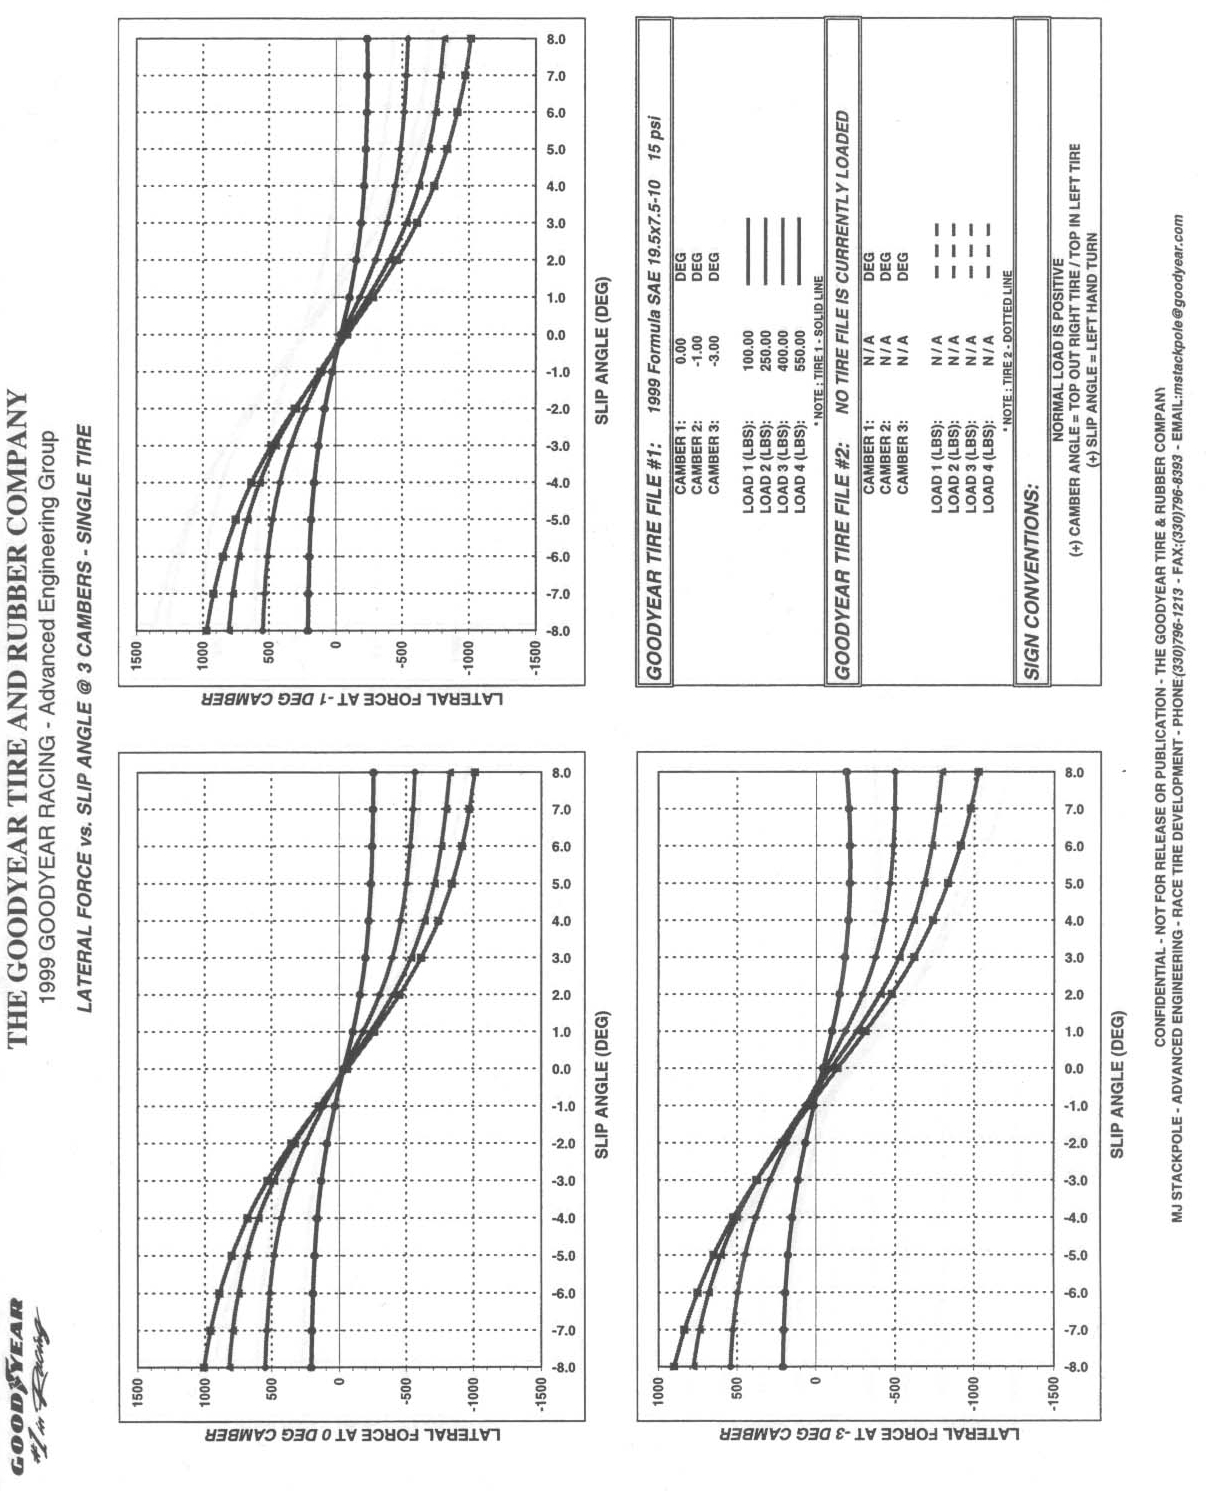
Figure 47. Tire curves showing lateral force generated as a function of various parameters for a 19.5x7.5x10 Goodyear tire. 61
Table 1. Specifications for the Princeton Formula SAE suspension system. 10
Table 2. A possible procedure for designing a Formula SAE race car suspension system. 11
Table 3. Effects on vehicle dynamic characteristics when parameters that deviate from the design intent. Bold values show the scenario that causes the worst effect on a given vehicle characteristic. Italic values show the scenario that causes the best effect on a given vehicle characteristic. A 20% lower CG clearly shows the most beneficial effects. The 40/60 weight distribution scenario is the worst for handling balance, the worst case roll center scenario creates the most body roll, while the 10% greater sprung weight scenario leads to the greatest load transfer. 17
Table 4. Specifications for the Princeton Formula SAE car steering system. 23
Table 5. Specifications for the Princeton Formula SAE car brake system. 34
|
Symbol |
Meaning |
|
CG |
Center of gravity |
|
G |
Acceleration equivalent to the acceleration of gravity on earth |
The primary goal of the suspension, brake and steering systems as a whole, in the context of a Formula SAE vehicle, is to provide a proper interface between the driver and the car such that a high level of road handling can be realized in a predictable fashion under all expected accelerations. Even when the limit of adhesion is reached, driver control and the ability to manage the vehicle is of paramount importance. Although superficially simple, the selection of parameters to achieve the ideal package of a vehicle control systems is the result of evaluating and weighing numerous competing objectives, many of which require iterative calculations and educated predictions of values that cannot be determined until an entire vehicle is constructed, instrumented and fully tested. This paper summarizes the design of the vehicle control systems that have been considered, not only by defining the important parameters alone but also by considering the effects of one parameter on the others. By analyzing parameters and objectives for the suspension, brake and steering systems not individually but realizing their interdependence, as is done in this paper, the art of race car vehicle control design becomes more manageable. The design considerations have resulted in the construction of the complete suspension, brake and steering systems for Princeton University’s first Formula SAE car. This paper also highlights the role and importance of computer simulation and parametric tools in design. It should serve as a summary of suspension, brake and steering basics in the context of a complete race car, as a list of lessons learned from design and also as a guideline for further exploration in future design iterations.
Defining the Vehicle Control Systems
The authors are defining the vehicle control systems to include the suspension, brake and steering systems. For a vehicle such as a Formula SAE car, the role of the vehicle control systems is to manage forces produced in accelerations from propulsion, braking, cornering and ground input. Providing a comfortable ride to the car’s driver is of less importance in a race car as long as the driver is not affected so severely that his or her physical ability for controlling the car is compromised. Instead, the ability for a driver to control the vehicle under expected accelerations is of foremost importance, and consideration even has to be given to the behavior of the car when the limits of adhesion have been reached.
A generic suspension system consists of three groups of components: suspension links or control arms (the solid members that define the structure of the suspension system), springs that absorb the energy from road inputs that would otherwise be transmitted directly to the vehicle body, and dampers (sometimes less appropriately referred to as shock absorbers) that control wheel and body motion by dissipating energy stored in the springs by means of heat. In addition, sometimes additional components such as anti-roll bars and third springs fine tune vehicle characteristics.
The constituents of a brake system include multiple masses (such as rotors) that rotate with the vehicle wheels onto which calipers, which do not rotate with respect to the frame, can apply a force. This force, through the use of brake pads, generates a torque about the wheels to slow the vehicle. The force is typically provided by a driver’s foot onto a pedal and then transmitted via hydraulics to each brake.
A steering system consists of a steering wheel through which the driver inputs his or her desired direction of travel, a steering rack or another mechanism that is fixed to the car frame for translating the steering wheel’s rotational motion to longitudinal, cross-car motion. Track rods connect the steering rack to the front wheels to cause them to steer.
It is important to remember that despite the analysis of the vehicle control systems detailed in this paper, all longitudinal and lateral accelerations generated by a vehicle are governed by the tires through their contact patches on the ground. Thus, behind all the calculations is the goal of managing the tires’ contact patches, and the ideal race car vehicle control systems are a combination that can transfer the forces needed to generate car accelerations to the ground in a manner that is most manageable for the tires on the ground. Due to the non-linearity of some components, especially the rubber tires, most models are insufficient in predicting the dynamic behavior in real world situations, so testing is absolutely necessary to verify the theory.
Despite the limited predictability of theory, it can provide a good starting point for car design. Using theory, the authors set out to find the most appropriate compromise among many objectives, including strength, stiffness, mass, and cost for Princeton University’s first Formula SAE car based on the philosophy described below.
Philosophy and Goals in the Context of Formula SAE
Formula SAE is an intercollegiate competition, sponsored by the Society of Automotive Engineers and by other organizations and corporations in which about 100 colleges worldwide participate. At the center of its competition concept is the construction of an open wheel formula race car that excels not only on paper but also by performing well in dynamic events.
Because a Formula SAE car entrant represents a prototype for the nonprofessional weekend autocross driver, the vehicle control systems on the car must thus be manufactured at a reasonable cost and feature reliability in addition to its dynamic performance. In the spirit of the competition, the design and manufacturing of the suspension system detailed in this paper reflects philosophical emphases embraced by the Princeton University Formula SAE team for its first car, namely simplicity, adjustability, upgradability and integration (with other components) and reliability. For prototypes, reliability is the greatest concern as the completion of events and tests would give the insight required to rethink and reconsider the major decisions that were made for the first iteration.
To place the vehicle control systems in context of a Formula SAE car, a picture of a Formula SAE car is provided in Figure 1, and a relatively recent photo of the Princeton Formula SAE car is shown in Figure 2. It is important also to keep in mind the environment in which Formula SAE cars are expected to perform. The dynamic events are held at a stadium parking lot that is relatively smooth and level asphalt except for unavoidable wear and tear. The vehicle is expected to compete in the following types of dynamic events: acceleration event, autocross (tight course to evaluate the car’s overall abilities), endurance race, and skidpad (circle track to evaluate the car’s steady state cornering ability). Wet weather performance is not a serious concern for Formula SAE cars.
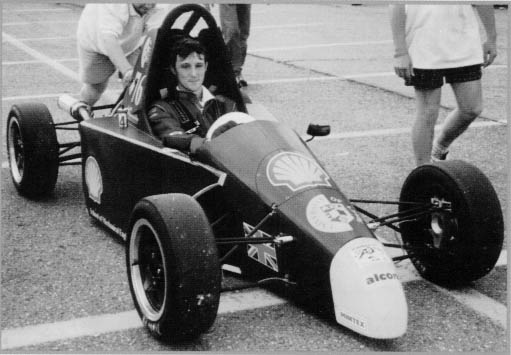
Figure 1. The University of Leeds Formula SAE car. (Formula SAE 1999 brochure)
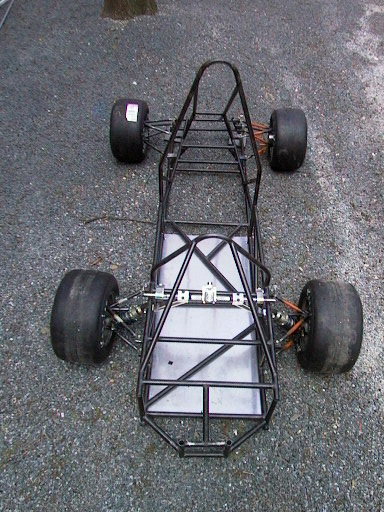
Figure 2. The Princeton Formula SAE car in April 2000.
Basic Assumptions and Estimates
Some assumptions and estimates need to be made clear at this point such that the capabilities of the vehicle can be better understood.
Overall laden vehicle mass with driver:
650 lb. This conservative (high) estimate is based on the tabulated data of the most recent Formula SAE entries and based on the masses of the completed components.
Static front/rear sprung mass (weight) distribution:
45% front, 55% rear (also denoted 45/55). These numbers mean that the fore/aft location of the center of gravity of the sprung mass is slightly to the rear of the midpoint between the front and rear tires. The sprung mass is the mass that is supported by the springs of the suspension system, which excludes items such as tires, wheels and most of the suspension and brake components.
Unsprung mass:
40 lb per front axle corner, 35 lb per rear axle corner. This is a measured quantity of the mass that is not supported by the suspension system and includes, if applicable, for each vehicle corner, a wheel, a tire, the control arms, the upright/hub assembly, a driveshaft, a brake rotor, a caliper and mounting hardware. The rear unsprung mass does not include a brake rotor and caliper because an inboard brake design is expected, but it includes a driveshaft for torque transmission, which the front suspension does not include.
Sprung mass center of gravity (CG) height:
13 inches. This is an estimate based on data from other Formula SAE entries and is on the conservative (high) side. A conservative value is assumed because the CG height plays a significant role in all the dynamic calculations, and a high CG height will underestimate the capabilities of the car.
Rigid frame:
Despite the careful analysis performed by the Body Division, it is natural for any vehicle frame to deflect under loading. In the preliminary design of a suspension system, however, the frame is generally taken to be infinitely rigid such that calculations and estimates can be performed. At the time of publishing this report, the Princeton Formula SAE Body Division is estimating a front to rear bending rigidity of 7000 Nm/deg and a side to side bending rigidity of 3150 Nm/deg. These numbers are significantly higher than those posted in January but still not up to professional racecar standards.
Highest steady state acceleration values:
Although many suspension characteristics determine the capabilities of the car, estimates of acceleration magnitudes are necessary to determine certain suspension parameters. The acceleration values suggested here are the result of discussions with other schools, published data in literature as well as test data from the Goodyear Tire & Rubber Company. Braking deceleration: 1.2 G Cornering lateral acceleration: 1.5 G. Forward acceleration: less than 1 G.
Ground clearance:
From discussion with other teams, a ground clearance of about 50 mm is sufficient to handle all accelerations for commonly used spring rates. Most initial calculations and design considerations were based on the ground to frame distance of 50 mm. However, because the Body division is using one inch outer diameter tubing, the actual ground clearance (before having the frame or skidplate scrape the ground) is closer to 36 mm. Calculations detailed later show that even this reduced clearance is sufficient to handle the highest steady state acceleration under the design conditions.
,.Wheelbase:
The wheelbase (distance between the front and tire contact patches) was set at 1700 mm early in the design process with other Princeton Formula SAE team members. This is just slightly below the majority of the competition as it was a goal to produce a somewhat smaller and more maneuverable car.
Track Widths:
Both the front and rear track widths (distance between the left and right tire contact patches) were specified, in collaboration with other Princeton Formula SAE team members, to be approximately 1200 mm. After construction, the track width is now 1200 mm for the front axle and 1130 mm for the rear axle. Track width at either end of the car can be increased by adding wheel spacers. As with the wheelbase, these track widths are slightly below the majority of the competition to create a relatively agile car at the sacrifice of slightly increased load transfer.
Despite the title of this paper, the brake system will be discussed last for continuity of the text and theory. Readers should note that most of the mathematical calculations are shown not in the body of the paper but have been performed using software. These calculations appear in the appendix, which starts on page
*.Because the vehicle control systems manage dynamic vehicle motion, it is necessary to clarify the motion terms. In addition to moving relative to the ground, the car’s motion relative to the wheels can be classified into four main dynamic modes: roll (vehicle rotation about the longitudinal X axis resulting from cornering forces), pitch (vehicle rotation about the Y cross-car axis resulting from longitudinal accelerations due to drive torque and braking), heave (uniform rectilinear motion along the vertical Z axis of each tire), and warp (the non-uniform variant of heave). Some of these terms will be used through the paper.
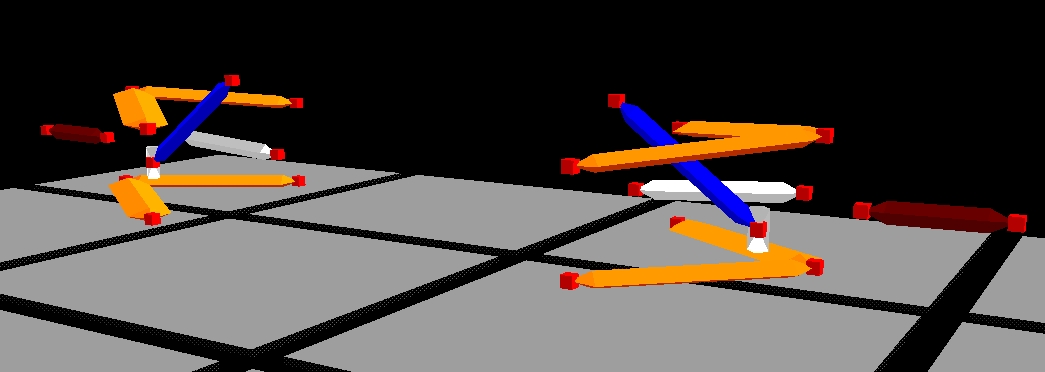
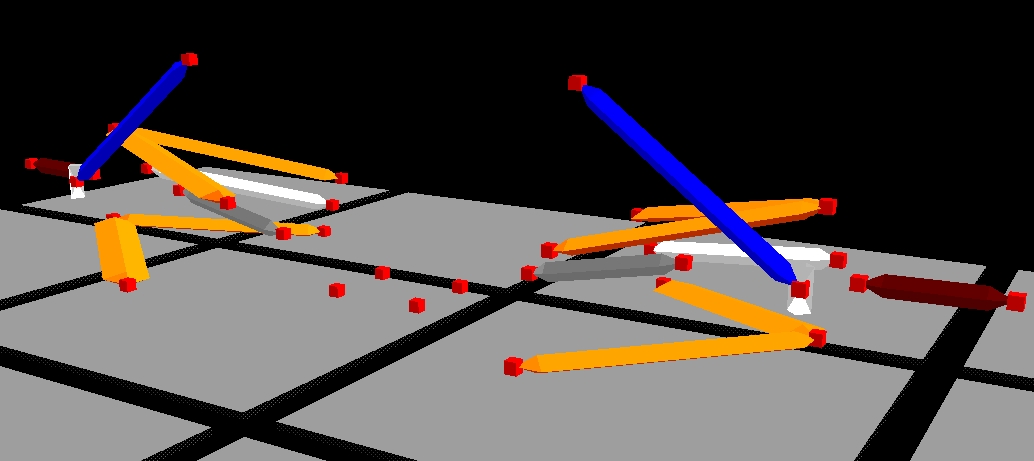
The suspension, brake and steering systems will be discussed in detail separately, but here are some pictures and data for the systems as a whole.
Figure 4. A schematic displaying the important suspension and steering pickup points. Shown is a left view viewed from outside the car.
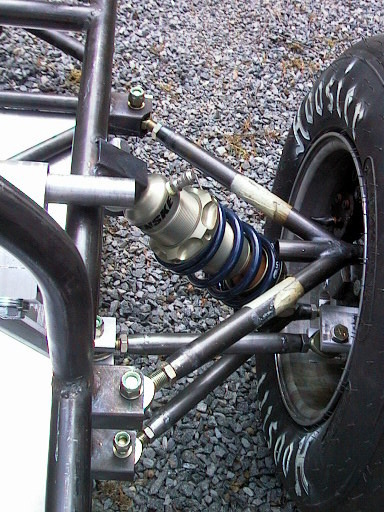
Figure 5. A semi-assembled front right suspension and steering system.
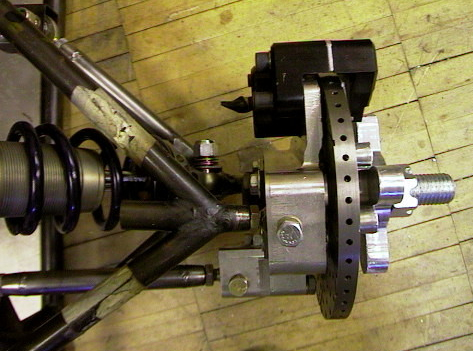
Figure 6. A top view of the same front right suspension system showing the brakes as well.
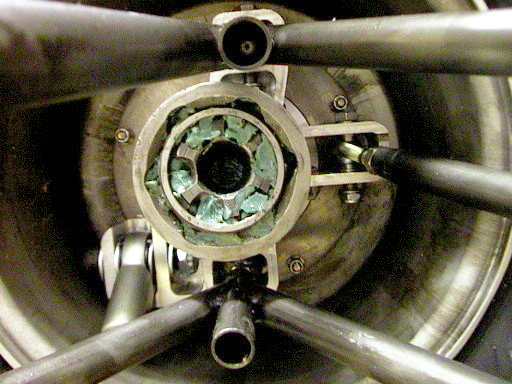
Figure 7. Inboard view of the rear right suspension assembly without the spring/damper unit.
The Suspension System
Some readers may be unfamiliar with the terms mentioned in the design overview since the jargon was introduced in "Simulating and Prototyping a Formula SAE Race Car Suspension System." Please refer to the appendix of definitions which starts on page
*.Design Overview
The suspension layout consists of fully independent, unequal length double A-arms at all four vehicle corners. Outboard coil springs over dampers provide the necessary springing and damping, and anti-roll bars will be incorporated into the front and/or rear suspensions if testing deems them necessary. The car rides on 10 inch diameter wheels shod with 7.5 inch wide tires with a rolling diameter of about 18 inches. A more detailed summary of the suspension system, including numerical values is given in Table 1. Some of the values presented in Table 1 have changed since January, and these will be discussed.
Some drawings of the latest Princeton Formula SAE suspension system’s components are shown in Figure 8. This can be compared with the design of January, 2000, as shown in Figure 9.
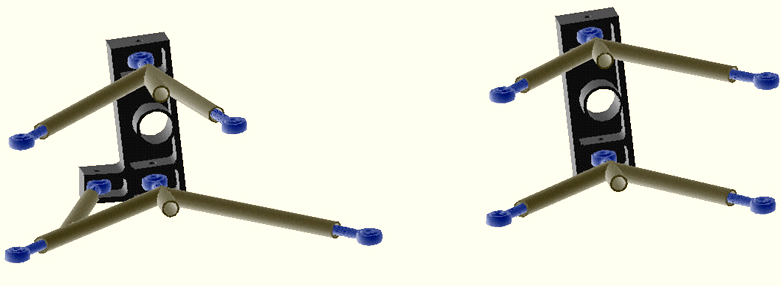
Figure 9. The uprights and control arms of the January prototype. Left figure shows the inside view of the rear left system. Right figure shows the inboard view of the front left system.
Table of Suspension System Specifications
|
Front |
Rear |
Units |
|
|
Overall Vehicle |
|||
|
Sprung mass CG height |
13 |
in |
|
|
Sprung mass |
225 |
275 |
lb |
|
Sprung mass distribution |
45 |
55 |
% |
|
Tire size |
18x7.5x10 |
18x7.5x10 |
- |
|
Track |
1200 |
1130 |
mm |
|
Unsprung mass |
80 |
70 |
lb |
|
Wheel diameter |
10 |
10 |
in |
|
Wheel width |
8 |
8 |
in |
|
Kinematics |
|||
|
Anti-dive |
12 |
- |
% |
|
Anti-lift |
- |
5 |
% |
|
Anti-squat |
- |
12 |
% |
|
Scrub radius |
51.5 |
- |
mm |
|
Caster |
8.1 |
6.0 |
deg |
|
Ground clearance |
36 |
36 |
mm |
|
Kingpin inclination |
0.6 |
1.5 |
deg |
|
Roll center height |
24 |
53 |
mm |
|
Static Camber |
-1 |
-1.5 |
deg |
|
Static Toe |
0 |
0 |
deg |
|
Dynamics |
|||
|
Motion ratio |
1.75 |
1.43 |
- |
|
Ride frequency |
2.8 |
2.5 |
Hz |
|
Ride rate |
91 |
90 |
lb/in |
|
Roll gradient |
1.6 |
deg/G |
|
|
Spring rate |
300 |
200 |
lb/in |
|
Damper rate (compression) |
14 |
11 |
lb/(in/sec) |
|
Damper rate (rebound) |
43 |
34 |
lb/(in/sec) |
Table 1. Specifications for the Princeton Formula SAE suspension system.
Design Procedure
The design procedure used by the authors is similar to that specified in Woods and Jawads’ guidelines but has undergone significant revision to produce an expanded version shown in Table 2.,
|
# |
Procedure |
Category |
Comments |
|
1a |
Establish vehicle parameters (size, weight, power, etc.) |
Preliminary |
The range of values for basic vehicle parameters such as size and power to weight ratio are defined, explicitly or indirectly, by the rules and regulations of the Formula SAE competition. |
|
1b |
Specify basic suspension type and geometric layout. |
Preliminary |
|
|
1c |
Specify springing medium layout (inboard/outboard) |
Preliminary |
|
|
2 |
Specify suspension kinematics details. |
Kinematics |
The specification of suspension geometry and kinematics, because of the details and iterative nature, takes considerable time despite only occupying one entry in this table. |
|
3a |
Estimate corner weights (sprung and unsprung). |
Dynamics |
|
|
3b |
Specify ride frequencies and ride frequency ratio. |
Dynamics |
The ride frequencies may need to be modified according to the expected wheel displacements calculated in step 3e. |
|
3c |
Derive ride, suspension and spring rates. |
Dynamics |
|
|
3d |
Derive initial roll rates without anti-roll bars. |
Dynamics |
|
|
3e |
Evaluate wheel displacement at maximum accelerative loads. |
Dynamics |
Repeat steps 3b-3e as necessary. |
|
3f |
Calculate lateral load transfer distribution (LLTD) between the front and rear axles without anti-roll bars. |
Dynamics |
|
|
3g |
Specify anti-roll bars to produce desired roll rates and LLTD. |
Dynamics |
Because Microsoft Excel can be used to determine derived values, anti-roll bar requirements need not be explicitly solved for. Instead, one can iteratively edit anti-roll bar dimensions until the desired LLTD is obtained. |
|
3h |
Specify damper rates. |
Dynamics |
Damper values can be specified as early in the procedure as after the derivation of spring rates. |
|
4 |
Select sizing and material of control arms and mounting hardware |
Loads |
Sizing and material selection can be made a higher priority in the design procedure if experience suggests that these parameters are attainable without compromising the dynamic factors significantly. |
Table 2. A possible procedure for designing a Formula SAE race car suspension system.
Revisions to Suspension Kinematics
Minimal revisions were made to the kinematics of the suspension system. The January prototype’s kinematics were deemed sufficiently well thought-out for the first Princeton Formula SAE car. Furthermore, revisions to the kinematics would generally entail reconstruction of the control arm tubes and/or relocation of the frame points.
The only revisions to suspension kinematics was the relocation of the front and rear suspension’s track rods. The January design for the rear suspension track rod was ungrounded in that the link which limited steering of the rear wheels was attached not to a solid frame member but to another portion of the control arms itself. This raised questions of reliability. The authors have since moved to a grounded track rod design, and a mounting point on the frame was chosen to obtain bump steer characteristics that are virtually identical to those from earlier specifications. The front suspension steering track rods were also moved from their initial expected locations with minimal effect on bump steer. More about these changes will be discussed together with the steering system, which begins on page
*.Some of the important suspension parameters are provided here again but without discussion of their implications, as the details are available in "Simulating and Prototyping a Formula SAE Race Car Suspension System."
Camber
For the Princeton Formula SAE car, the static negative camber is set at -1° for the front tires and -1.5° for the rear tires and can be varied by adjusting the rod ends at the uprights. The camber curves (camber with respect to bump) for the front and rear suspension system of the Princeton Formula SAE car are given as Figure 10, with the camber required to maintain a flat contact patch also plotted for comparison. The front suspension’s camber curve is less aggressive (less camber change with wheel displacement) because caster is used to generate camber for the front suspension.
Figure 10. Suspension camber curves.
Since toe is the angle at which the tires are pointed away from straight ahead, it will be discussed with the steering system which begins on page
*.The Princeton Formula SAE car incorporates 8.1° of positive caster on the front suspension system. The camber gain from caster alone is shown in Figure 11 and helps to explain why less camber gain is built into the control arms for the front suspension system. The rear caster angle is 6.0° . However, because the rear wheels do not steer, the rear suspension caster angle is unimportant for suspension kinematics.
The existence of a non-zero caster angle results in changes in camber as the front wheels steer, in addition to the camber induced by the bump and rebound of the wheels. The camber attributable to caster alone is shown in Figure 11.
Figure 11. Caster induced camber for the steering front wheels.
Scrub Radius
Because the scrub radius depends on the upright, brake and wheel components, they were not precisely specified in "Simulating and Prototyping a Formula SAE Race Car Suspension System." With the components now complete, the front scrub radius is known to be 51.5 mm, and the rear scrub radius is 13.5 mm.
Kingpin Inclination
An error made in the analysis of kingpin inclination resulted in the authors quoting a zero kingpin angle in "Simulating and Prototyping a Formula SAE Suspension System." With the latest analyses, the front kingpin angle is 0.6° at the front wheels and 1.5° at the rear wheels. Since kingpin affects suspension kinematics only when the wheels are steered, the rear kingpin angle has no influence on suspension kinematics. The minute front angle only changes the camber curve very slightly.
Roll Centers
The Princeton University Formula SAE car has its roll centers at 24 mm above ground at the front and 53 mm above ground at the rear. Throughout all expected roll behavior, the rear roll center remains above the front roll center. Figures 12 and 13 show the roll center heights as a function of body roll.
Front Anti-Dive
A 2° tilt of the front suspension’s control arms about the transverse axis of the Princeton Formula SAE car (higher at the rear from the side view) results in about 12% anti-dive, assuming that the front wheels contribute 60% to the total braking torque.
Rear Anti-Squat/Anti-Lift
The rear suspension control arms are also tilted about the car’s transverse axis, at 1.3° . This results in 5% rear anti-lift (assuming that the rear wheels contribute 40% to the total braking torque) and 12% rear anti-squat.
Revisions to Suspension Dynamics
The Microsoft Excel worksheet used for suspension dynamics calculations is given in the appendix on page
*. There have been a few changes in this area of the Formula SAE car suspension system in the interest of reliability, resulting in new motion ratios for both ends of the car. In "Simulating and Prototyping a Formula SAE Race Car Suspension System," ride frequencies for both the front and rear suspension were specified, and the estimated sprung and unsprung masses were used to determine the necessary spring and damper rates as well as their physical dimensions. Because some of these changes were implemented after the purchase of springs and dampers, the resultant ride frequencies and other dynamic characteristics have changed. A summary of the latest values were given in Table 1.The main changes to the front suspension that affect suspension dynamics were limited to the slight adjustment of the positions of the spring/damper units. The changes addressed two primary concerns, both concerning load paths. First, the January design allowed for a significant bending load at the mounting bracket at the frame due to the angle of the bracket. Secondly, the bracket on the control arm transferred load to only a small section of the A-arm that contains the lower ball joint, placing it in bending as well. To resolve the first issue, the bracket was reoriented such that, in full bump travel when the loading is the greatest, the restoring forces from the spring and damper would be inline with the bracket and subject it to only negligible bending load. Bracket dimensions were changed as a result. To resolve the second issue, the bracket on the control arm is now not mounted directly to a control arm. Instead, it is mounted onto a plate that distributes any load from the bracket onto all three control arm tubes.
As a result of these two changes, the front suspension motion ratio is now 1.75 instead of 2.04. It should be noted that the new bracketry design only accounts for part of this change. Another contributor was that the January specifications were based on a slightly erroneous emulation of an outboard suspension system. This motion ratio change meant that, to obtain the same front suspension dynamics, the spring rate needed to be reduced. In other words, utilizing springs designed for the original brackets resulted in a stiffer front suspension. With the new motion ratio, to obtain the original specified front ride frequency of 2.0 Hz would require a spring rate of about 150 lb/in as opposed to the original 200 lb/in specification. Because springs of 150 lb/in in the required dimensions were only available by custom order, the closest available springs were specified at 300 lb/in, translating to an increase in ride frequency from 2.0 Hz to 2.8 Hz. This is a significant change, but the authors feel that some testing should be performed prior to purchasing new springs that would restore the original dynamics. Furthermore, there was also a concomitant increase in the rear suspension’s ride frequency, although attributable to other factors.
The change to the rear suspension was linked to a suggestion already provided in "Simulating and Prototyping a Formula SAE Race Car Suspension System." Specifically, the January design mounted the lower end of the spring/damper unit in the middle of the lower front control arm, placing a bending load in an undesirable area. After the consideration of various alternatives, the lower end of the damper is now mounted in a pocket on the upright itself. However, this change meant that the old damper units did not offer enough length to reach the frame. The authors have since fabricated an extension to replace the lower spring perch and lower mounting point to add length to the damper unit. The design is such that the damper extension is small in diameter at its lower end so that it fits into the upright with no clearance problems. Longer and better supported brackets can be found at the frame side.
The new design resulted in a motion ratio of 1.43 instead of the 2.61 found in the January specifications. Because this change was partially finalized before the purchase of the rear springs, the rear ride frequency did not change as much as the front suspension’s. In numbers, the rear ride frequency is now 2.5 Hz instead of 2.2 Hz with the use of a 200 lb/in springs.
Because both the front and rear ride frequencies have increased since the January design, the car now rides stiffer, and wheel bump and rebound travel will be less than the previous design’s at a given acceleration. This helps to nullify earlier ground clearance concerns. However, this added stiffness and lack of compliance may result in increased bumpiness and traction degradation over imperfect pavement. If this is verified during testing, new springs can be specified, subject to budget constraints.
The authors are also aware that because the front ride frequency increased more than the rear ride frequency, handling balance changes can be expected.
That is, the front axle’s greater resistance to roll will mean more understeer in steady state conditions. This effect is partially beneficial because it eliminates the need for a front anti-roll bar. However, with the purchased rear hub, the rear track reduced from 1200 mm to 1130 mm. This increases rear lateral load transfer slightly and partially offsets the understeer resulting from the increased front ride frequency.
As can be seen in the dynamics calculations in the appendix on page
*, the front to rear load transfer distribution of 49/51 is numerically the same as that of the earlier design that utilized softer springs and a front anti-roll bar. Although this implies that the handling balance will not change after all, a concern still exists with the front suspension’s ride frequency being higher than the rear’s, which could result in undesirable vehicle pitching on bumpy roads.In summary, although the changes made to the suspension system are numerically significant, the authors have taken care in implementing these changes such that the most important consideration—handling balance—is not seriously compromised. Thus, testing is necessary to confirm the authors’ assumptions.
Sensitivity Analyses Based on Latest Data
The sensitivity analyses performed in "Simulating and Prototyping a Formula SAE Race Car Suspension System" is repeated here with the latest available values. This is the authors’ attempt to determine how sensitive derived values are to basic parameters. Extreme sensitivity may make calculations invalid since deviations from design in the car mass, for example, may result in very different vehicle characteristics. The results of the analysis is shown in Table 3.
|
Units |
January Design Intent |
Latest Design Intent |
Worst Case Roll Center |
15% Lower Ride Frequency |
10% Greater Sprung Weight |
40/60 Weight Distribution |
20% Lower CG |
|
|
Load transfer per G longitudinal acceleration |
lb |
103 |
113 |
113 |
113 |
122 |
113 |
91 |
|
Front wheel travel at 1.2 G longitudinal acceleration |
mm |
34 |
19 |
19 |
26 |
20 |
19 |
15 |
|
Roll gradient |
deg/G |
2.0 |
1.7 |
2.5 |
2.4 |
1.9 |
1.7 |
1.2 |
|
Total lateral load transfer per G lateral acceleration |
lb |
150 |
170 |
171 |
170 |
183 |
170 |
136 |
|
Wheel travel at 1.5 G lateral acceleration |
mm |
31 |
27 |
38 |
37 |
29 |
27 |
19 |
|
Lateral load transfer distribution |
49/51 |
49/51 |
43/57 |
45/55 |
49/51 |
49/51 |
49/51 |
|
|
Lateral load transfer distribution deviation from sprung mass distribution |
4% front bias |
4% front bias |
Even |
4% front bias |
4% front bias |
9% rear bias |
3% front bias |
Table 3. Effects on vehicle dynamic characteristics when parameters that deviate from the design intent. Bold values show the scenario that causes the worst effect on a given vehicle characteristic. Italic values show the scenario that causes the best effect on a given vehicle characteristic. A 20% lower CG clearly shows the most beneficial effects. The 40/60 weight distribution scenario is the worst for handling balance, the worst case roll center scenario creates the most body roll, while the 10% greater sprung weight scenario leads to the greatest load transfer.
Without going into too much detail, as calculations are shown in the appendix on page
*, a lower ride frequency than expected, a greater vehicle mass and a lower center of gravity does not alter the theoretical balance of the vehicle significantly. In all of these cases, the difference between the lateral load distribution and the sprung mass distribution does not differ by more than a percent from a car built to the latest design conditions (which transfers 4% more weight through the front axle than the sprung mass distribution of 45/55). With the worst case roll center scenario, however, more weight is transferred through the rear axle, leading to a possible oversteer condition. Furthermore, the worst case roll center scenario represents a situation when the rolling moment is the greatest, leading to the largest roll gradient. The most significant change in the lateral load transfer distribution’s deviation from the sprung mass distribution is for the scenario when the when the sprung mass distribution is assumed to be 40/60 instead of 45/55. In this scenario, more of the load transfer is resisted by the front axle compared to that in design condition, leading to understeer.The sensitivity analysis performed here is relatively basic. Ideally, all the parameters should be varied simultaneously since they depend on each other, and an iterative or numerical procedure is required. Overall, the sensitivity analysis shows that the car is not overly sensitive when parameters deviate from the originally assumed conditions.
In "Simulating and Prototyping a Formula SAE Race Car Suspension System," the suspension design using the parametric software, Reynard Kinematics, was discussed. Here are the latest schematics of the suspension systems.
The coordinates that generate the above are given in the appendix on page
*.Suspension Components and Manufacturing Details
This subsection summarizes the parts of the suspension system as well as their manufacturing details. In addition to the ¾ inch by 0.058 inch 4130 chromoly steel tubing used for the control arms and the 6061-T6 aluminum for the uprights for which load analyses were already performed, the suspension also consists of spherical ball rod ends, chromoly adapters that are threaded to connect the rod ends to the control arms as well as chromoly brackets that attach the suspension to the frame. At each rod end location, 6061-T6 aluminum bushings are manufactured out of round tubing to allow for greater misalignment tolerances of the rod ends. This is necessary as the rod ends do not offer sufficient misalignment seen when the wheels travel in bump and rebound without the use of these bushings. Springing is by 2.25 in. inner diameter Hypercoils coil springs, and damping is provided by custom Penske 8750 single-adjustable dampers with single-adjustable damping.
For the front suspension system, the interface between the rotating wheel and the non-rotating suspension components is a 6061-T6 aluminum hub mounted onto a stationary steel spindle. The spindle is a long 1 inch diameter bolt. This bolt is welded onto a rectangular plate, which bolts into the upright. The hub then rotates about the spindle via the use of wheel bearings. The wheel is mounted onto the outboard end of the hub through 4 computer numeric controlled (CNC) tapped holes that house wheel studs, while the inboard side of the hub is manufactured for mounting the brake rotor via 4 cap screws. Various other hardware is used to secure the components together.
Because the rear wheels need to provide drive torque, a stationary bolt-based spindle cannot be used. Instead, the authors decided on utilizing a hub from a late-80s Volkswagen GTI. The details regarding this decision are not the focus of this paper, but the main reason is that this hub is easily combined with the driveaxles, constant velocity joints and Torsen differential since all of these components are Volkswagen/Audi parts. The stainless steel Volkswagen hub, in its Princeton Formula SAE car application, is drilled and tapped to fit wheel studs, and other modifications are done to decrease its mass. Bearings ride on this hub and are housed in cutouts in the rear upright itself.
On the inboard side of the hub and upright is a Volkswagen GTI constant velocity joint. Due to the smaller size of a Formula SAE car, the joint is modified such that it would not interfere with the rear suspension’s control arms. The constant velocity joint came as a package with a driveaxle and plunging inboard constant velocity joint.
The rear suspension system’s lower control arms also utilizes rod end bushings as with the front suspension system. Due to the high angularity of the other members, high-misalignment rod ends were purchased, and these do not require the bushings. The materials for the control arms and for the uprights are the same as those used for the front suspension system.
Of the various components, the uprights and the front hubs are done via computer numeric control (CNC), while the other items are made or modified using traditional methods. With the various changes implemented, the suspension mounting brackets were remade numerous times such that the important suspension points would remain at the correct distance from the centerline of the car in the cross-car direction. For fore/aft location, the front suspension box members was used as reference for the front suspension, and the most rearward vertical plane of the car was used as reference for the rear suspension. Some brackets also had to be remade to accommodate for frame tolerances.
Suggestions for Future Iterations
Currently, adjustability of the kinematic parameters is done via the rod ends at the A-arms. Because the frame mounts are fixed, the fore/aft distance (with respect to the frame) between the front and rear rod ends of each A-arm is also fixed. With the current design, the change in position of any of the rod ends would affect multiple kinematic parameters, resulting in the requirement of adjusting other rod ends. It is suggested that, in future design iterations, the inboard rod ends be mounted into additional tubes that run in the cross-car direction. This will allow the easy change of track width as well as more independence in the adjustment of parameters.
As with other kinematic parameters, it is difficult to determine what changes are necessary prior to testing. However, an area of concern is that the front roll center changes significantly with bump and rebound, which may give rise to changes in load transfer distribution and unpredictability during cornering.
Although aluminum has a greater strength to weight ratio which encourages its use in suspension parts due to the need to reduce unsprung mass and rotational inertia, its fatigue and stiffness characteristics may result in kinematic distortions under high accelerations. Further study of the material properties of aluminum is necessary to justify its use. A stronger 7075 aluminum can also be considered, as well as various grades of steel. However, the short duty cycle of Formula SAE cars may deem fatigue considerations inconsequential, so the reconsideration of aluminum is essentially a stiffness concern.
Some suspension components are secured not with the use of nuts but by threading into aluminum. This may not be sufficiently resistant to loosening via vibration and alternative methods should be considered. Additional analysis can be performed at each fastener to determine if fastener sizing can be changed to minimize mass. An effort to standardize fastener sizes may also speed assembly times.
A major constraint that affected all vehicle control systems was the 10 inch diameter of the wheel. The authors feel that using a 13 inch diameter wheel will alleviate many of the clearance issues that they faced and that the increased flexibility to choose suspension kinematic and mounting points will likely be more beneficial than the possible increase in mass associated with a 13 inch diameter wheel.
At this juncture, the authors do not recommend implementing inboard springs and dampers yet as an outboard system appears to be flexible enough and offers reduced complexity.
Because the brackets need to correct for the imperfections of the frame, these items should be made after the frame has been built. The angles and distances determined from calculations alone will most likely not suffice since the frame is not perfect.
A greater effort should be made to ensure that the suspension pickup points at the frame be as close to a frame node or member as possible. This is so that bending loads on the brackets can be minimized. This is sometimes not possible due to clearance issues between the frame and the rod ends and/or nuts and bolts.
The current front scrub radius of 51.5 mm may result in excessive sensitivity to road imperfections and also cause large loads on the spindle and front suspension components. Future iterations can consider alternatives to reduce the scrub radius, either by using more compact components, wheels with more positive offset or by incorporating a greater kingpin inclination.
Although the current design does not use anti-roll bars because the dynamic calculations show that the car will be relatively balanced without them, plans should be made to include anti-roll bars because they are a useful tuning tool. With anti-roll bars, the roll gradient can be reduced without increasing the ride frequencies, and this independence may prove beneficial on rough roads where high ride frequencies compromise traction. As mentioned in "Simulating and Prototyping a Formula SAE Race Car Suspension System," the use of a rear anti-roll bar may not be suitable for a Formula SAE car because high lateral load transfers generated with anti-roll bars may aggravate the lifting of the inside rear wheel during cornering.
Some discussion on steering with respect to toe and bump steer was provided in "Simulating and Prototyping a Formula SAE Race Car Suspension System." This section of the paper will elaborate on the details of a Formula SAE race car steering system. Even though only the front wheels steer, some of the information in this section is important even for the rear wheels as they can toe in and out minutely with wheel travel and under loading.
The basic design of the Princeton Formula SAE car steering system is a center-mounted rack and pinion system using rack extensions and track rods mounted to the front uprights and allows the inside front tire to steer to a maximum of 31° from straight ahead. The driver provides steering inputs through a 250 mm diameter D-shaped steering wheel mounted on a quick-release hub. Rear wheel steering is restricted using track rods connecting the uprights to the frame.
Table of Steering System Specifications
|
Front |
Rear |
Units |
|
|
Overall steering ratio |
3.6 to 3.3 |
- |
:1 |
|
Ackermann |
Perfect Ackermann (within 1° ) until 26 of inside wheel angle |
- |
- |
|
Maximum inside wheel angle |
31 |
- |
deg |
|
Lock to lock steering wheel angle |
135 |
deg |
|
|
Bump steer |
Minimal toe-in with bump (0.003° per mm) |
Minimal toe-out with bump (0.008° per mm) |
|
|
Caster |
8.1 |
deg |
|
|
Kingpin inclination |
0.6 |
deg |
|
|
Static Toe |
0 |
0 |
deg |
|
Steering wheel diameter |
250 |
mm |
Table 4. Specifications for the Princeton Formula SAE car steering system.
Important Steering System Parameters
The overall steering ratio is an important parameter because it determines how "quick" the steering is. Like many parameters, steering ratio is partly a driver preference, but some guidelines do exist. For comparison, the steering ratio for race cars vary from the slow Superspeedway cars of about 20:1 to the go-kart with about 1:1. A very fast ratio will be more sensitive to the driver’s steering inputs, but extreme sensitivity may increase driver fatigue or make it difficult for the driver to keep the car pointed in the desired direction when road inputs jerk the driver’s hands. At the other extreme, too slow a ratio will require large hand movements, which is not desirable for the tight Formula SAE courses. For a Formula SAE car, an additional guideline is that the steering ratio be quick enough such that all the tracks can be negotiated in less than one rotation of the steering wheel from lock to lock (full left to full right). This is so that the driver does not have to shuffle his or her hands around which would again reduce the car’s maneuverability.
In order to negotiate the tightest corners (7 m outer diameter) for the Formula SAE circuits with less than one rotation of the steering wheel, a steering ratio of about 8:1 or quicker is required. The Princeton Formula SAE race car steering system has a ratio of about 3.5:1. This ratio is perhaps on the fast side as only 135° of steering wheel rotation is required to go from full left steer to full right steer. The authors had planned to develop a system with a ratio close to 8:1 but repositioned the steering track rods after the purchase of the rack due to some clearance issues.
Figure 20 shows how the front wheels turn for a given steering wheel input by the driver.
Figure 20. Steering angle response shown by comparing the average front wheel steering angle with the steering wheel angle.
The overall steering ratio itself is plotted as a function of steering wheel angle in Figure 21.
Figure 21. Overall steering ratio. This is the slope of Figure 20.
From Figure 21, it can be seen that the steering system is not entirely linear. That is, the steering ratio decreases (quickens) with steering wheel input angle. Although excessive or strong non-linearity can result in unpredictability, slight non-linearity as shown in Figure 21 is somewhat desirable because the steering ratio quickens with steering wheel angle, so a quick ratio can be obtained in tight corners without making straight-line driving too sensitive to steering inputs.
Because the overall steering ratio provides a torque magnification from the steering wheel to the rotation of the front wheels, it also determines the steering effort required to turn the front wheels. For a light Formula SAE car, this should not be a primary concern. Should the effort be unmanageable, a slower steering ratio can be implemented. Alternatively, a larger scrub radius can decrease steering effort, but a large scrub radius is not recommended due to the other undesirable effects as described in "Simulating and Prototyping a Formula SAE Race Car Suspension System." The trail of the suspension can also be reduced such that the wheels have a smaller re-centering moment. Additionally, the centrifugal caster can be reduced.
Bump Steer
The Princeton Formula SAE car has a toe curve that goes minutely toward toe-in on bump for the front tires, as shown in Figure 22. This bump steer characteristic, although minute, helps to increase stability in braking by pointing the front tires toward each other and also helps to turn the tires in the steered direction during a turn.
In the January design of the rear suspension, there was no bump steer. The authors have since, together with the change to using grounded track rods, incorporated slight toe-in with rebound, as shown. This allows for increased toe-in and stability under braking. The toe change is kept to a minimum because excessive toe-change at the rear wheels can result in unpredictable behavior. See Figure 23.
The static toe values are not explicitly specified because they can be altered by adjusting rod ends on the tie rods. The authors plan on setting the front tires to have about -0.1° of toe (toe-out) and the rear toe is specified to be 0.1° (toe-in) for initial testing. Any static toe-in or toe-out will introduce a vertical offset to the respective curves.
Ackermann Steering
One consideration in steering design is the amount of Ackermann to employ. Although in the interests of tire wear and reduced rolling resistance street cars are almost always designed with perfect Ackermann, this is not always the best solution for race cars. Before discussing the details of Ackermann, it should be noted that Ackermann becomes almost a non-issue on high speed cars that only negotiate large turns because the wheel angles are so minute that the Ackermann angles are negligible.
The theory behind using non-perfect of even reverse Ackermann is due to the non-linear nature of the tires. In order to generate the maximum cornering potential at a given axle, each tire should be loaded such that it produces the greatest lateral (cornering) force. For most tires, a lightly loaded tire requires less slip angle to generate maximum lateral force. This characteristic is only slightly visible in the Goodyear tire data given in the appendix on page
*. Because load transfer occurs during cornering, decreasing the vertical load on the inside wheel, the inside wheel would perform better if its slip angle were reduced. This can be done by incorporating parallel steer or reverse Ackermann.Although the reason behind proper Ackermann is to allow each tire to generate as much cornering force as possible, the authors have heard that the amount of load transfer for Formula SAE cars is so significant that the inside wheel essentially provides none of the cornering force in the tight turns. In other words, the ability of the car to turn is essentially only dependent on the outside tire, in which case Ackermann becomes a non-issue. For this reason and because perfect Ackermann reduces rolling resistance, when the car is pushed, for example, the authors have decided to implement perfect Ackermann. However, due to packaging constraints, perfect Ackermann was not possible, so the Princeton Formula SAE car has slightly more than perfect Ackermann. That is, the difference in the inside and outside wheel angles is slightly larger than is necessary to maintain no side-scrub, as shown in Figure 24. In Figure 24, the excessive Ackermann effects can only be seen at high wheel angles. However, should testing prove that the Ackermann is seriously compromising the handling characteristics of the car, the Ackermann can be modified slightly by repositioning the outer track rod point since this is a separate part that is bolted onto the upright.
Figure 24. The Ackermann steering characteristics (theoretical vs. the Princeton Formula SAE car's steering).
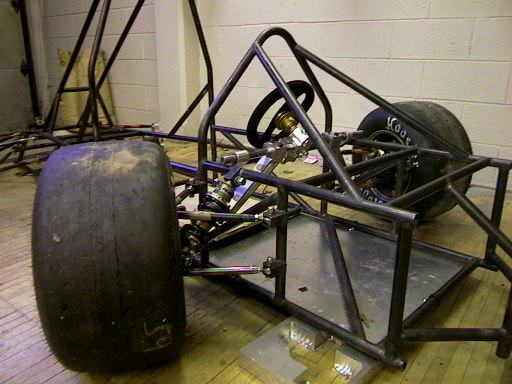
Figure 25. This view of the car clearly shows the Ackermann steering effect that causes the inside wheel to steer more than the outside wheel.
Front Steer vs. Rear Steer
Front steer and rear steer affect the way that Ackermann is implemented. As shown in Figure 35, when rear steer is used, perfect Ackermann is achieved by having the outer track rod points inboard of the steering axis. For front steer, the outer track rod points need to be ahead of the steering axis. For packaging reasons, it is usually easier to have the track rod points inboard of the steering axis. This is one reason for why the Princeton Formula SAE car uses rear steer. Steer configuration also affects compliance steer, which is discussed below.
Compliance Steer
Compliance steer is especially evident on street cars that use rubber bushings. Although the Princeton Formula SAE car does not use any rubber bushings, compliance steer can result from the bending, twisting, pulling or pushing of any assumed rigid components. Because compliance steer is often non-linear and difficult to model, suspension and steering components should be designed such that any compliance steer creates an understeer effect. In other words, front suspension members should behave in a way to cause toe-out, and rear suspension members should cause toe-in. This way, the heavily loaded outside tires will point, due to compliance understeer, in a direction that increases the turning radius. When the contact patch of the heavily loaded outside tire provides a lateral force on the suspension pointing toward the car body, the compliance is such to generate positive camber. To generate compliance understeer for the front wheels (toe-out), the track rods should be located in the upper rear of the wheel or the lower left of the wheel, as shown in Figure 34. For both of these locations, when the outside wheels are forced to positive camber, the track rods, in resisting the positive camber, will provide a torque about the steering axis that causes understeer.
Due to packaging constraints and the decision to employ steering that is close to perfect Ackermann, the authors initially chose to go with a rear steer design for the front wheels, with the track rods placed above the center of the wheels. However, it was found that the upright design needed to provide for locating the outer track rod points high above the wheel steering angle restricted the wheel steering angle. As a result, the track rods are now at the height of the center of the wheel. Theoretically, this will not result in any sort of compliance steer.
For the rear wheels, the track rods should be in the unshaded areas of Figure 34 to produce toe-in of the outside wheel under lateral loading (again, compliance understeer). In implementation, the track rods for the rear suspension system are also very close to the wheel center height, so compliance steer is also virtually eliminated.
Caster and Kingpin Inclination
Caster was discussed with the suspension system in terms of its camber effects but is discussed here as well because it affects the self centering tendency of the steering wheel. In particular, the self centering torque is a function of the difference of left-right load in cornering. This means that changes in vertical load will not affect self-centering torque, but lateral load transfer will. In other words, the self-centering effect of caster is primarily a result of the difference in vertical load between the left and right wheels during cornering. The effect of caster is that, As load transfer increases, steering effort increases, and this effort can be a good form of feedback to the driver to inform him or her of the cornering of the car. As the front tires’ limits of adhesion is reached, their pneumatic trail will decrease, causing a lightening of the steering and the reduction of the self-centering moment, allowing the driver to feel the loss of traction and to adjust accordingly.
Kingpin Inclination was also discussed earlier but is repeated here because it also contributes to the self-centering moment. Its contribution to the self-centering moment is a function of the entire axle’s load, and the self-centering torque results because, with kingpin inclination, the front axle lifts when the wheels are being steered, increasing the front axle’s load.
The effective difference between the self-centering moments resulting from caster and kingpin is that the kingpin inclination’s moment will be sensitive to braking and acceleration, while the caster’s moment will be affected by road imperfections, suspension asymmetry, roll stiffness and by cornering loads. When vehicle pitch is taken into consideration, however, braking and accelerating will change the caster angle. For example, when the car pitches forward by 2° , the caster angle will also reduce by about 2° if the suspension moves straight up and down, thereby reducing the self-centering moment upon braking. The Princeton Formula SAE car front suspension, however, moves slightly forward (about 2° forward of vertical upon braking due to the anti-dive design), so the change in caster during braking is reduced. Specifically, at 1.2 G of braking, the front suspension will bump by 19 mm, and the rear will rebound approximately the same amount. With the wheelbase of 1700 mm, this is equivalent to about 1.3° of pitching. Under these conditions, the caster reduces to about 7.5° , which is only 0.6° away from the static caster of 8.1° .
Under heavy braking, the pneumatic trail from the tires, which typically produces a self-centering moment similar to that of caster, can reduce and even reduce direction. If the reversal is strong enough, the self-centering torque may disappear completely, which can be a source of instability.
In summary, the self-centering moment from kingpin inclination and caster is dependent on a variety of parameters and cannot be determined conclusively from basic theory. Some suggestions are given on page
* as to what can be done if the self-centering effect appears to be unstable during testing.Steering Components and Manufacturing Details
The steering rack is a purchased steel and aluminum unit, manufactured by Woodhaven Industries/Stiletto Steering. See Figure 26. The rack ratio can be changed for a minor fee if it is found that the current overall ratio of about 3.5:1 is found to be too quick. The track rods are constructed out of 4130 chromoly steel ¾ inch by 0.058 inch round tubing, using threaded inserts onto which rod ends attach, just as with the suspension control arms. Oppositely threaded rod ends are used on the track rods for easy toe adjustment.
Initially, a steering pod was designed to extend inboard of and above the upright onto which the outer track rod that steers the front wheels can be mounted. However, a clearance issue was observed between the steering pod and the control arms on the inside wheel. As a result, the track rod was moved from above the wheel centerline to the height of the wheel center. Because this height was the height at which the driver’s legs would be, the steering rack had to be placed either above of or below the wheel centerline height. In order to create the desired bump steer characteristics, "z-link" extensions were designed to locate the track rod inner points out of the way of the driver’s legs. See Figure 27. The z-links (one on each side) are fabricated with computer numeric control using 6061-T6 aluminum and clamp onto prescribed locations on the steering rack. An I-beam cross-section is used to reduce mass while providing a high degree of stiffness.
To prevent the rack from bending from asymmetric loads generated during cornering, side supports that maintain the rack location relative to the frame are also made out of 6061-T6 aluminum, in addition to the center steering rack mount. See Figure 28. These side supports clamp onto the frame and have oil impregnated sintered bronze plain bearings to allow the rack to slide relatively easily.
The 250 mm D-shaped Alpha steering wheel (Figure 29) attaches to a Troyer quick release hub. The hub has a boss that is welded onto a 0.675 inch by 0.095 inch steering shaft made out of 4130 chromoly tubing, whose other end is welded onto a bored coupler. The coupler mates the steering shaft to the splined pinion on the Stiletto rack and is clamped onto the pinion.
As mentioned earlier, a modular front outer track rod attachment was fabricated. This is a 6061-T6 aluminum piece that bolts onto the front upright. See Figure 30. With this modular piece, the bump steer characteristics and, to a lesser extent, the overall steering ratio and Ackermann can be adjusted by replacing this small piece without replacing the entire upright. Furthermore, the outer track rod attachment being made as a separate piece, allows the front upright to be fabricated out of thinner stock than would other wise be possible.
Suggestions for Future Iterations
The steering system, because it was designed after the suspension system, caused numerous clearance issues in addition to the one mentioned in this paper. The current design utilizing the "z-link" adds an additional component, meaning that relative motion between assumed rigid parts is more likely and contributing to unpredictable compliance steer. With the current frame and suspension design, the authors see no viable alternative solutions. To foresee clearance issues at an earlier stage of design would likely require a solid model of the entire car; motion capabilities would be very helpful as well.
The authors’ steering design incorporates a generous amount of caster. If excessive steering inconsistency under braking results, caster can be reduced, or the steering axis can be translated toward the rear of the car to reduce the mechanical trail. This may not solve the problem but the caster angle be a contributor to braking induced steering effects. Should the reduction in caster decrease the self-centering effect significantly, kingpin inclination can be added to restore some recentering moment. This will affect the camber curve, so complete revision of the suspension kinematics may be necessary.
Again, a larger wheel diameter would provide more flexibility in which to place components.
Although bushings help to reduce the friction of the rack in its operation, these bushings resist motion if the rack is slightly out of alignment under loading. Future iterations can replace these plain bearings with bearings that take small amounts of misalignment.
As the locations of the steering components are judged to be appropriate after testing, clamped components should either be welded or pinned to the frame to reduce unwanted motion.
The Brake System
Due to the nature of the Formula SAE dynamic events—tight radius turns and short straightaways—a Formula SAE car’s brake system has provide high levels of deceleration repeatedly. In the interests of reliability and safety, the authors have decided to use disc brakes for both the front and rear axle.The front axle consists of two outboard floating single-piston calipers while the rear axle uses a single inboard fixed dual-piston caliper acting through the spool axle or the input shaft of a torque sensing limited slip differential.
Table of Brake System Specifications
|
Front |
Rear |
Units |
|
|
Design deceleration |
1.2 |
G |
|
|
Design pedal force |
120 |
lb |
|
|
Swept area |
350 |
sq. in / ton |
|
|
Rotor diameter |
7.5 |
8.0 |
in |
|
Total caliper piston count |
2 |
2 |
|
|
Caliper piston diameter |
1.75 |
1.75 |
in |
|
Master cylinder diameter |
0.75 |
0.875 |
in |
|
Fluid line pressure |
750 |
500 |
psi |
|
Nominal brake bias |
60 |
40 |
% |
Table 5. Specifications for the Princeton Formula SAE car brake system.
Important Brake System Parameters
Much of a brake system can be characterized by its limits. Among many factors, the important limitations of a system’s performance includes force, deflection, wear, temperature and tire traction. The discussion below will look at these limitations indirectly.
Inboard vs. Outboard Rear Brakes
A preliminary design decision involved whether the brakes for the rear were to be of an inboard or outboard design. The primary argument for an inboard system is the reduction of mass, especially unsprung mass. Whereas outboard brake components add mass to the vehicle corners and are thus unsprung units, an inboard system has its components near the center of the rear axle, and some of the components are supported by the springs of the car. Furthermore, whereas an outboard brake system would require a pair of all components (one at each wheel) such that braking is balanced left to right, one set of components suffices for an inboard brake system because an inboard brake acts on part of the drive system before the torque to the left and right wheels are split. An inboard system thus allows the use of half the number of components with its mass being sprung. Utilizing an inboard design also reduces the complexity of the components in the wheel area, which can provide for better compromises for suspension characteristics.
However, an inboard system places torques onto the frame. That is, whereas the control arms provide the reaction torque to the brake calipers under brake application with outboard brakes, the frame directly provides the restoring torque. This may mean that the frame area where the inboard caliper is mounted needs to be more substantial and heavier. Depending on the drive configuration, the center of the rear axle may already be sufficiently crowded with the chain sprocket and differential components, so using an inboard setup may not be very straightforward either.
With these considerations in mind, the authors decided to implement an inboard system for the rear axle. As mentioned above, an inboard system applies its brake torque to a point "upstream" of the differential. This means that the left-right torque distribution is very dependent on ground traction as the braking torque at each rear wheel is not modulated individually. The exact characteristics of the torque distribution will depend greatly on the rear axle configuration such as the type of differential, or the lack of one. In general, with a solid or locked axle, or a good torque sensing limited slip differential, the brake torque distribution is not a grave concern.
A brake system must be able to dissipate efficiently the heat that is built up through deceleration. Improper management of heat dissipation will lead to brake fade, where either the pad is working beyond its designed temperatures or the brake fluid boils and is unable to apply brake pressure because the fluid is now gaseous and can compress.
Typically, the heat sinks are the rotors, although surrounding components such as the caliper and brake fluid and suspension components will often see an increase in temperature through conduction and convection. Because the brake pads’ coefficient of friction changes with temperature, and the brake fluid itself may boil and cause excessive pedal travel, it is important to use as large of a heat sink as possible. For the Princeton Formula SAE car, brake cooling is of special concern since the wheel faces are solid so no air flows from the outside to cool the rotors. Also, the rotors are deep within the wheel, so air flow from inboard side of the brakes may not be that effective either. The rotors, in rotating, may aid convective cooling, but the flow in the wheel well area is not well understood and cannot be assumed to offer large amounts of cooling.
The authors have thus decided to use rotors that are as large as possible. The front rotors are 7.5 inches in diameter and 0.5 inches thick. The rear rotors are 8.0 inches in diameter with the same thickness. They are made of cast iron, which has a high heat capacity and negligible thermal expansion and are drilled along their circumference (vented) and cross-drilled (on their faces), as well as being slotted. Although drilling and slotting reduces the mass and thus the heat capacity of the rotor, these procedures are common in the racing industry because airflow and thus convective effects more than offset the reduction in mass. Calculations as shown in the appendix on page
* reveal that, for a 1.2 G deceleration from 50 mph to 10 mph, 45 kJ of energy needs to be dissipated, resulting in the rotors heating up about 19° C. This figure is based on no dissipation from the brake rotor to the surrounding air by convection or to the adjacent components by conduction. Although this temperature rise is not very significant, closely-spaced repeated stops may drive the rotor temperatures much higher. It is also worth noting that, although the energy dissipation from 50 mph to 10 mph is the same regardless of the rate of deceleration, stronger deceleration will require the heat to be dissipated more quickly. Because the rotors are a large heat sink, temperatures across them are usually not uniform during and shortly after brake application. Thus, proper cooling is necessary as strong temperature gradients between rotor areas can lead to warping of the rotors. In addition to the translational energy of a car in motion, some energy is stored as rotational energy of the wheels, tires, hubs, rotors, etc. This energy is usually not that significant and adds about 10% to the non-rotating kinetic energy that needs to be dissipated.In tight courses such as those for the Formula SAE cars, the cars spend a large amount of the lap time under braking. This means that the ability for a car to decelerate will affect lap times significantly. With a greater ability to decelerate, more time can be spent building up speed to the next corner. To be competitive, the authors feel that the brakes should be able to provide at least 1.2 G of deceleration. How this deceleration is attained depends on many parameters, most of which are included in the calculations shown in the appendix on page
*.The deceleration limit is based on many factors, some of which are discussed here. First, there is a limit as to how much force the driver can apply onto the pedal. Using bathroom scales and a simulated in-car seating position, it was determined that a pedal force of 120 lb is easily applied. Over 150 lb can be applied, but repeated application would not be desirable. This pedal force is then given a mechanical advantage (lever arm effect) by the pedal assembly. The authors have chosen a system with a 5.1:1 mechanical advantage. The force is then split into two master cylinders, each one responsible for the brakes on each axle. A hydraulic advantage results from the ratio of the pistons’ areas at the calipers to the master cylinder areas. The components selected allow for a hydraulic advantage of 11 at the front axle, and 8 at the rear axle. With the estimation of the brake pad coefficient of friction at 0.4, and the radial location of the brake torque application, just under 600 lb-ft of torque can be applied with 120 lb of pedal force to slow the car. With the weight of the car 650 lb, this translates to an acceptable deceleration of 1.2 G. Also provided in the appendix on page
* is the swept area per ton. This is important because, when material is being removed from a sliding surface, the friction force is dependent on the interfacial area. The Princeton Formula SAE car brake system posts 350 square inches of swept area per ton. The numbers discussed here show how the physical dimensions of the brake components affect deceleration, but details concerning the tire traction characteristics need also be modeled. This is discussed in the following subsection.The brake torque distribution is crucial because maximum deceleration will not be achieved unless all tires are brought to their friction peak simultaneously. In other words, if 600 lb-ft is necessary to provide the deceleration, applying all of this force through the front wheels will possibly cause the front tires to lock, thereby not making effective use of the rear tires’ traction. It is when each vehicle corner contributes a proportion that is similar to their vertical load that maximum deceleration can be attained. However, vertical load depends on the deceleration rate itself, so the optimum balance is, in application, an iterative process. The calculations on page
* show that, the fore/aft vehicle weight distribution under 1.2 G of braking is about 58/42 and so the front/rear brake bias was adjusted to mirror this distribution.Milliken suggests that the brakes should be biased initially more toward the front than what is suggested by calculations. This is such that the front wheels will have the tendency to lock first. Front wheel locking is a stable effect, whereas rear wheel locking can lead to a spin. However, when road imperfections do not allow for 1.2 G of braking, or when the tires are not performing at their peak capabilities, the load transfer from the rear axle to the front axle will be less, so the brake bias should be biased more toward the rear or else the front wheels will lock too easily.
Brake pads come in a variety of compounds for different friction characteristics, usually quantifiable with a coefficient of friction vs. temperature plot. The material of the rotor also has an effect on brake pad friction. Tradeoffs need to be made between how stable a brake pad is across its useable temperature range, its highest achievable friction coefficient as well as its wear characteristics. Without more quantitative data regarding the brake pads and expected temperatures, it is difficult to specify the brake pad compounds conclusively. However, in general, the coefficient of friction between the brake pad and the rotor is about 0.4.
The authors will be using pads designed for colder temperatures as these are usually stable up to mid-temperatures, and also because the light Formula SAE cars do not usually create extreme brake temperatures.
One variation in calipers is the number of pistons that they contain. The greater the number of pistons, the greater the braking torque for a given fluid pressure. Furthermore, using more small pistons results in a stiffer caliper than one large piston. Another variation is in the motion of the pistons. A fixed caliper has an even number of pistons; in a two piston design, for example, a piston from each side of the rotor moves toward the rotor to provide the clamping force. A floating caliper usually has a single piston on the inboard side of the rotor. As one piston causes the inboard brake pad to push on the rotor, the caliper moves in a direction opposite to that of the brake pad, thereby bringing the other outboard brake pad to contact the rotor. At equilibrium, both pads will apply the same clamping force to the rotor.
Floating calipers are self adjusting in their design, so brake pad wear is theoretically even. However, in reality, brake pad wear is more of a problem with floating calipers because the imperfect floating mechanisms can cause binding or angled pad wear and possibly leading poor brake modulation. Fixed calipers are usually not self-adjusting, but they are stiffer and apply even force on each side of the rotor, assuming that the rotor is aligned to be at the center of the two sides of the caliper. Fixed calipers are usually wider to allow for two-sided clamping.
For the reasons of packaging within the small wheel area, the authors have chosen to use single piston floating calipers on the front wheels. Furthermore, a floating caliper tends to cool better because the active piston and fluid are only on the inboard side of the rotor. In the rear, where the inboard brakes allow for more clearance, a dual piston fixed caliper is employed.
Another important parameter with calipers is their piston size. The piston sizes needs to be determined together with the master cylinders such that appropriate hydraulic advantage ratios can be achieved to provides sufficient stopping power, especially in the absence power assist.
A variety of master cylinder designs exist. The Formula SAE regulations dictate two separate hydraulic systems for the front and rear brakes, so Formula SAE cars must have two master cylinders, one for operating the brakes at each end of the vehicle. Pushrods connected to the pedal assembly applies forces on the pistons within the master cylinders to displace the brake fluid. The master cylinders draw brake fluid from a reservoir, sometimes integral, sometimes remote. In either case, the fluid reservoirs must be large enough to move the brake pads to their full clamping position.
Piping and fittings for the brake fluid must not only be able to withstand the high line pressures (over 700 lb for the front axle on the Princeton Formula SAE car), but they must also be stiff or else the brakes will feel spongy and unresponsive to a driver. Material choice is also important due to corrosion and chemical property changes that may affect brake system performance. For racing, it is common to choose brake fluid with the highest possible boiling point and to use stainless steel braided tubing and fittings throughout.
Brake System Components and Manufacturing Details
As aforementioned, the rotors are drilled in their circumference, cross-drilled as well as slotted. The cast iron rotors were purchased from Cervone’s Competition Karts. However, they came in an 8 inch diameter, so they were turned down to 7.5 inches for the rotors in the front wheels to clear the wheel inner diameter. The rotors have six fingers to attach onto the hub, but only four are used for the front brake system, where they are mounted onto a hub just inboard of the wheel. On the rear axle, the rotor is attached onto the spool axle adjacent to the sprocket for the chain drivetrain, and the original 8 inch diameter remain unmodified.
Calipers were also purchased from Cervone’s Competition Karts but are manufactured by Wilwood Engineering. The front floating calipers have 1.75 inch diameter pistons and float on their mounting pins. They mount on the front uprights which also have a retention mechanism such that the inside pad does not rotate about the cotter pin that locates it vertically. The front caliper mounting points need to be tapped perfectly because the floating pins are integral with the mounting bolts. As with other components for which alignment is critical, the holes for the mounting bolts are tapped with computer numeric control. The outboard side of the front calipers are also milled down slightly to reduce the scrub radius. The rear calipers are of the fixed design but also have (two) 1.75 inch diameter pistons and are mounted onto a plate that locates the rear axle.
Brake pads that fit the Wilwood calipers were purchased from Chassis Shop Performance Products and measure approximately 1.7 inches x 1.8 inches. These are Cold Stopper pads, chosen for their cold stopping capability. Because of their light weight, Formula SAE cars generally do not generate extremely high brake temperatures if proper cooling is provided. Furthermore, high temperatures are unlikely during light duty testing.
Master Cylinders
The Princeton Formula SAE car uses lightweight composite master cylinders from Wilwood. The front master cylinder has a 0.75 inch piston, while the rear master cylinder has a 0.875 inch piston. These master cylinders fit the pedal assembly by design and have large reservoirs and long strokes.
A Wilwood pedal assembly was sourced from Chassis Shop Performance products. The pedal mechanical advantage ratio is 5.1:1, and the pedal is a swing mount design (hinged at the top), which is necessary given the dimensions of the car’s frame. The pedal assembly allows the master cylinders to be reverse mounted, i.e., with the reservoir farther rearward in the car than the pedal, again to fit within the frame constraints.
The assembly is mounted to the car frame via two computer numeric controlled aluminum bridges that clamp onto two transverse frame rails. The frame area near the brake pedal area receives some of the highest loads due to the mechanical advantage of the pedal system. Puhn estimates up to 600 lb forward load and a 200 lb side load on the pedal pad. The pedal assembly has an integral balance bar.
The Princeton Formula SAE car adjusts brake bias using a balance bar that comes with the pedal assembly to distribute the pedal force to the front and rear master cylinders in a proportion specified by the position of the pushrods on the bar. Care has been taken in sizing the caliper pistons and master cylinders such that the master cylinder pushrods are within specified angles since high misalignment can cause mechanical failure.
The brake fluid routing has not been fully designed yet, but the authors plan to use stainless steel braided tubing throughout and high temperature racing brake fluid.
Suggestions for Future Iterations
Because of the binding issues associated with floating calipers, a fixed caliper design can be considered for future iterations. The current wheel size does not allow for fixed calipers at the outboard front brakes unless a significant scrub radius is introduced.
The authors have oversized the rotors due to concerns of brake cooling. Should this prove not to be a problem in testing, thinner rotors can be used to decrease mass. This will also reduce the polar moment of inertia of the rotating components, allowing for faster acceleration and braking.
On the other hand, should heat be a problem such that it raises the temperature of the upright and wheel bearings significantly, a rotor hat can be added as an additional heat sink between the rotor and other suspension components. This has the unfortunate consequence of an increase in scrub radius.
It is recommended that a set of pads designed for higher temperatures be used during racing or under rigorous testing as the current Cold Stoppers are not designed for very high temperatures.
Brake bias is a tuning tool for the driver. A remote adjuster can be added to the brake balance bar should frequent adjustments be necessary.
Following the theoretical guidelines of industry experts, university professors and experienced Formula SAE peers, the authors have succeeded in designing, analyzing and constructing a set of vehicle control systems for Princeton University’s first Formula SAE car, incorporating the suspension, brake and steering mechanisms. Except for some items that remain to be manufactured, the design and integration of the vehicle control systems are essentially complete.
In terms of the larger picture of creating a successful race car, however, much remains to be done. In many parts of the paper, the authors have raised concerns that can only be evaluated with extensive testing. In addition to isolated tests on the strength and stiffness of the individual components, dynamic testing is essential in evaluating the car as a whole. For a racecar to be successful, not only do the individual components have to perform up to expectations but the entire car also needs to work well as a system. It is for testing reasons that the Princeton Formula SAE team has stressed reliability among other design philosophies.
Before more is mentioned about testing, however, the authors would like to summarize the important lessons learned through this project. Over two semesters, it has become obvious that the majority of the components that make up the vehicle control systems, and even some of the other parts of the car, need to be designed together. This is because much of the complexity of a car’s systems only reveals itself when relative motion and packaging constraints are considered. As designers of the first iteration of the Princeton Formula SAE race car, the authors at times lacked foresight on clearance issues. If possible, future designers should attempt to make as complete a model of a car as possible. At the very least, details regarding attachment points of the suspension, brake and steering systems should be finalized prior to the construction of any final parts. The authors would like to suggest going to a larger size wheel diameter for greater flexibility in component location. However, the current design should be extensively tested prior to making that change.
Technical and design recommendations have been scattered throughout this report, but little has been mentioned regarding possible test procedures. Although the authors have done static checks such as verifying the locations of attachment points, this does not say much regarding the behavior of the vehicle under load and acceleration. Thus, the next step is to verify the operation of the individual components as independently as possible. Although it is true that, for instance, changing the static camber will affect toe and bump steer characteristics, and that parameters cannot be changed in isolation easily, it is possible to run relatively simple tests to make sure that camber curves, among other parameters, are to specification.
For the vehicle as whole, skidpad and short slalom tracks can be set up to determine the overall traction limits and balance of the vehicle. The data collected from such procedures can be augmented using data acquisition equipment that can give accelerations and forces as a function of time, track location, etc. Before numerical data are taken seriously, however, they have to show consistency and validity. By validity, the authors mean that changes in front wheel camber, for example, should affect front end traction. If instead, no change in handling characteristics can be observed and the car instead accelerates noticeably faster with a different camber setting, then the theory is questionable or the parameters have a much larger scope of effect that needs to be considered. Consistency is as important as validity. Only when changes in camber can reproducibly affect cornering traction is the provision for adjustable camber worthwhile. A car that is overly sensitive to the most minute adjustments or one whose reactions cannot be attributable to any source will be very difficult to improve.
Despite the testing that is required to validate the authors’ design in this paper and in "Simulating and Prototyping a Formula SAE Race Car," the authors feel that they have successfully tackled the challenges of creating vehicle control systems for a dynamic and interactive system such as a Formula SAE car and that they have learned a copious amount regarding not only vehicle design but also team dynamics. It is the authors’ hope that the technical information and suggestions provided will make future iterations of the Princeton Formula SAE car successful at the competitions.
Adams, Herb. Chassis Engineering: Chassis Design, Building & Tuning for High Performance Handling. Los Angeles: HP Books, 1993.
Aird, Forbes. Race Car Chassis: Design and Construction. Osceola: Motorbooks International, 1997.
Alexander, Don. Performance Handling: How to Make your Car Handle: Techniques for the 1990s. Osceola: Motorbooks International, 1997.
Carter, Campbell D., Cindy B. Sherman, and Ronald D. Matthews. "Design of a Formula SAE Race Car: Vehicle Dynamics and Performance." SAE Paper 821092, 1982.
Formula SAE 1999 brochure.
Gillespie, Thomas D. Fundamentals of Vehicle Dynamics. Warrendale: SAE, 1992.
Lopez, Carl, and Danny Sullivan. Going Faster: Mastering the Art of Race Driving: Cambridge: Bentley, 1998.
Puhn, Fred. Brake Handbook. New York: HPBooks, 1985.
Milliken, William F., and Douglas L. Milliken. Race Car Vehicle Dynamics. Warrendale: SAE International, 1995.
Smith, Carroll. Carroll Smith’s Engineer in Your Pocket: A Practical Guide to Tuning the Race Car Chassis and Suspension. 1998.
Staniforth, Allan. Competition Car Suspension Design, Construction, Tuning. 3rd ed. Somerset: Haynes, 1999.
Staniforth, Allan. Race and Rally Car Source Book: The Guide to Building or Modifying a Competition Car. 4th ed. Somerset: Haynes, 1997.
Gaffney, Edmund F. III, and Anthony R. Salinas. "Introduction to Formula SAE Suspension and Frame Design." SAE Paper 971584, 1997.
Goodyear Tire & Rubber Company. Tire Data for Formula SAE Program. Akron: Goodyear Technical Center.
Woods, David E, and Badih A. Jawad. "Numerical Design of Racecar Suspension Parameters." SAE Paper 1999-01-2257, 1999.
Various catalogs and brochures.
Vehicle Control Systems Definitions
Most of these definitions were discussed in greater detail in the body of the "Simulating and Prototyping a Formula SAE Race Car Suspension System" paper.

Figure 34. Suspension and steering geometry. (Milliken)
Ackermann (Steering)
When a car negotiates any turn, the outside tires travel in a circle of a larger radius than the inside wheel (by an amount approximately equal to the track width of the vehicle). Thus, the outside tire should be made to steer less than the inside tire. When the relation between the tire angles are such that no side scrubbing of the tire occurs, true Ackermann geometry is said to be employed. If the wheels are designed to steer exactly the same angle, this is called parallel steer. Reverse Ackermann is when the outside wheel steers more than the inside wheel despite it having to travel in a larger circle.
For a given average steering angle, the amount that the inside and outside tires have to turn, respectively, are given in Equation 1.
Equation 1. Wheel steering angles to obtain proper Ackermann steering geometry.
Ackermann is adjusted by moving the track rod point on the upright either inboard or outboard of the steering axis. Perfect Ackermann is achieved when the lines joining the steering axes and the outer track rod points converge at the center of the rear axle, as shown in Figure 35. If the lines converge behind the rear axle, perfect Ackermann is not reached. If the lines converge ahead of the rear axle, excessive Ackermann is being used.
An anti-roll bar is usually a torsion bar that couples the left and right wheels on a car with independent suspension such that, when only one wheel tries to bump or rebound independently of the other, the anti-roll bar is placed in torsion. The anti-roll bar acts as a spring that resists independent motion of the wheels. A true anti-roll bar does not have any dynamic effect when both the left and right wheels try to move together such as during braking.
Balance Bar
A brake balance bar is an adjustable lever such as a threaded rod that pivots on a spherical bearing. The brake pedal pushes on a pivot near the center of the bar, which then pushes on the pushrods of the master cylinders. By moving this center pivot closer to the pushrod of one master cylinder, that master cylinder gets a higher proportion of the brake pedal force. A brake balance bar is a common method of adjusting brake bias.
Brake Bias
Brake bias refers to the amount of brake torque that the front axle generates compared to that produced by the brakes at the rear axle. It is typically expressed in percentages of total brake torque. Brake balance needs to be matched to approximately the vertical load on the axles in order to get maximum stopping efficiency. Too high of a front brake bias will tend to lock the front wheels first, causing understeer, while too much rear brake torque will lock the rear wheels first, causing unstable oversteer.
Bump, jounce or compression is used to describe the motion of the wheel and tire when they move upward with respect to the vehicle body. See Figure 36.
Bump steer is the change in toe with wheel travel, and it occurs because the tie rod can be of a different length or oriented differently with respect to the rest of the control arms. For example, if the tie rod is mounted below the wheel centerline, and its radius of curvature is shorter than the radius of curvature of the other control arms, the tire will toe-out on both bump and rebound. This is shown in Figure 37.
If, on the other hand, the radius of curvature is correct but the end of the tie rod is mounted too high on the upright side of the suspension or too low on the side of the steering rack, the tire will toe-out on bump and toe-in on rebound. This causes both wheels to steer out of the turn and can be used as an understeer effect. See Figure 38.
Calipers are assemblies that apply clamping force onto the brake rotors. The brake pads are mounted onto the calipers while pistons within the calipers use fluid force to push the pads onto the rotors. A variety of caliper designs exist, some of which are discussed in the body of the paper, on page
*.Camber
Camber is the angle by which a tire deviates from being perpendicular to the ground when viewed from the front or rear of the vehicle, as shown in Figure 36. The camber is negative if the angle between the inboard side of the tire and the ground is acute and positive if this angle is obtuse.
Caster is the angle that the steering axis deviates from vertical in the side view of a vehicle, as shown in Figure 38. If the lower ball joint is forward of the upper ball joint, the caster angle is positive. Caster is important when the wheels are steered, so it has minimal effect on the rear suspension system.
Centrifugal caster is unrelated to the caster angle. When the center of mass of the items that rotate when the front wheels are steered lies ahead of the steering axis, centrifugal caster exists with the result that the wheel has a tendency to toe-out. Centrifugal caster is adjusted by selecting the position of components such as the brake caliper to position the center of mass of the steering components.
Compliance steer refers to the wheels steering slightly away from design intent under cornering. For example, the steering rack can compress or stretch when both wheels on the front axle move up and down. In roll, a bending moment may be applied to the steering rack. Furthermore, any relative movement between assumed rigid parts can cause compliance steer.
A disc brake system is one that uses rotating discs (known technically as rotors) that spin with the wheels. Calipers that do not rotate apply clamping force to the rotors to slow down the car. Disc brakes are now being used on most wheels of most production cars and are almost always used on race cars. The trend toward disc brakes over other designs such as drum brakes is due to reasons including better cooling, better water and dirt resistance, less maintenance, greater surface area for a given weight of brake and, most noticeably, increased resistance to brake fade (reduction in brake effectiveness with use).
Front steer refers to the steering track rods being in front of wheel centerline. Therefore, to steer to the right, a track rod would pull on the left wheel and push on the right wheel.
Inboard Brakes
Inboard brakes refer to a brake system with the rotors and calipers removed from the wheels and near the center of the car. Rotors on an inboard brake system slow down the driveaxles, differential or another rotating element near the centerline of the car. Most inboard brake systems rely on the frame to provide the reaction torque to slow a car down.
The kingpin inclination (also referred to as the steering axis lateral inclination) is the angle that the steering axis deviates from vertical in the front or rear view of a vehicle. See Figure 36.
Load transfer refers to the phenomenon where the acceleration of the vehicle body causes a change in the vertical load experienced by the tires from what they were when the vehicle was not accelerating.
Master cylinders are units that translate brake pedal force into fluid pressure. Pistons within the master cylinders displace fluid that moves the brake pads to clamp onto the rotors. Master cylinder sizing is important to obtain the correct hydraulic advantage and brake torque.
Motion Ratio
The motion ratio is a dimensionless number that compares the motion of two items. In this report, the motion ratio is defined as the ratio of wheel travel per unit of the spring and damper’s movement.
A neutral steer attitude is one that is characterized by neither understeer nor oversteer.
Outboard Brakes
Outboard brakes refer to a brake system with the rotors and calipers near or in the wheels of the car. With outboard brakes, the upright and suspension components provide the reaction torque to slow the car.
Oversteer is easily perceived by the driver as the rear tires losing traction and that the rear end of the vehicle is about to initiate a spin.
Piston
Pistons are found in both the master cylinders and the calipers. The master cylinder pistons push fluid through the brake fluid lines onto the pistons in the calipers in order to apply clamping force to the rotors.
Rear steer refers to the steering track rods being behind the wheel centerline. Therefore, to steer to the right, a track rod would push on the left wheel and pull on the right wheel.
Rebound, droop or extension is used to describe the motion of the wheel and tire when they move downward with respect to the vehicle body.
The ride rate is the vertical force per unit of vertical displacement of the tire contact patch relative to the fixed frame. The value of the ride rate is the effective rate using the wheel rate and the tire rate in series. Thus, for any tire that is not infinitely stiff, the ride rate is always less than the wheel rate. In most motorsports (Formula 1 is a notable exception), the tire rate is several orders of magnitude greater than the wheel rate, so the ride rate can be approximated as the wheel rate itself.
The ride frequency is the ride rate, normalized by the mass of the sprung corner weight and expressed in Hertz or cycles per minute. Because the ride frequency is scaled by the sprung mass, its value is applicable across different vehicle types regardless of the vehicle weight. Also, the static wheel deflection per unit of vertical acceleration can be mapped directly with the ride frequency.
Brake rotors (often called discs) are a primary part of disc brake system. They are literally discs that rotate with the wheels and tires. Brake pads clamp onto a rotor to slow the rotor and wheel. Rotors often have holes or slots in them to help convective cooling since they are the primary heat sink for energy dissipated in slowing a car down.
Scrub Radius
Scrub radius is the cross-car (left-right) distance between the contact patch of a tire and where the steering axis intersects the ground. The scrub radius is considered positive if the tire contact patch is farther outboard than where the steering axis intersects the ground.
The slip angle is the angle between the direction of tire heading and the actual direction of travel of the wheel. If a lateral load exists such that the contact patch points in a slightly different direction from the rest of the tire, a slip angle exists. Another way of picturing slip angle is by imagining the angle between the wheel plane (which defines the intended direction) and the contact patch’s direction of travel.
The spring rate is simply the constant of proportionality between spring displacement from equilibrium and its restoring force. Despite the definition above, the spring rate may not be constant. Manufacturing processes and the spring geometry may be tailored to provide a progressive spring (one whose rate increases with displacement from equilibrium) or a digressive spring (one whose rate decreases with displacement from equilibrium).
The steering axis is the line about which the front wheels steer relative to the car when steered. The dotted lines in Figure 34 above shows the steering axis in both the front view and side view. In practice, the steering axis is usually not perfectly vertical and perpendicular to the ground, for reasons to be discussed under Caster, Kingpin Inclination and Trail.
The overall steering ratio is defined as the angle of steering wheel rotation per angle of front wheel rotation. In the case of steering geometry other than pure parallel steer, the inside and outside wheels will have a different steering ratio. The authors take the average of the inside and outside wheel angles to determine the overall steering ratio.
The tire rate is the vertical force per unit of vertical displacement of the tire. A tire can be modeled as a spring that deflects under vertical load. Using this model, the tire rate is the spring rate of the tire.
Toe is the angle at which the tires point toward or away from each other from the top view of the car. Toe-in (or positive toe) is when the tires point toward each other in the direction of travel. Toe-out (or negative toe) is when the tires point away from each other in the direction of travel.
Trail is the fore/aft distance between the contact patch of a tire and where the steering axis intersects the ground. Usually, the steering axis intersects the ground at a point forward of the contact patch of the tire. Figure 34 shows the physical interpretation of mechanical trail. Because the tire rubber deforms, the real contact patch of a tire is to the rear of what Figure 38 indicates. This additional trail, the pneumatic trail, adds to the mechanical trail to form the total trail. Trail does not affect the rear wheels since they don’t steer.
Understeer is perceived by the driver as the tendency of a car being unable to make a turn that is as tight as the driver inputs. Technically, understeer is defined by slip angles, steering wheel angle gradients and Ackermann steer angle gradients, among other parameters.
Mild understeer usually goes unnoticed by the inexperienced drivers who simply turn the steering wheel more, although the car usually feels like it’s running wide and that more steering wheel rotation is required.The wheel rate is the vertical force per unit of vertical displacement at the wheel centerline relative to the fixed frame.
Wheel travel is not an official term, but in this paper, it is used to mean the bump and rebound motions of the wheel, tire and related suspension components.
Reynard Kinematic Points for the Front Suspension
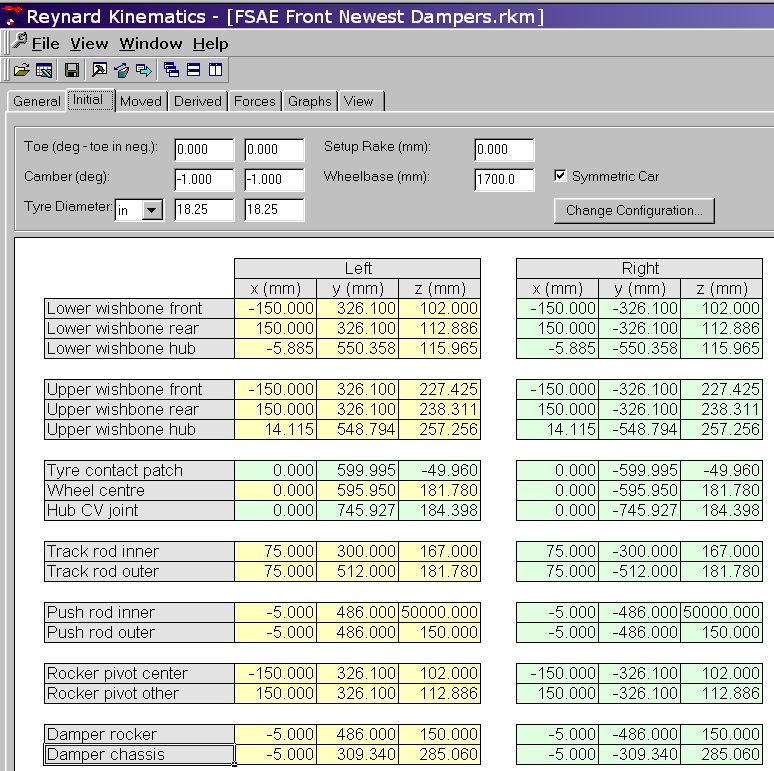
Figure 39. Coordinates for the front suspension system.
Reynard Kinematic Points for the Rear Suspension
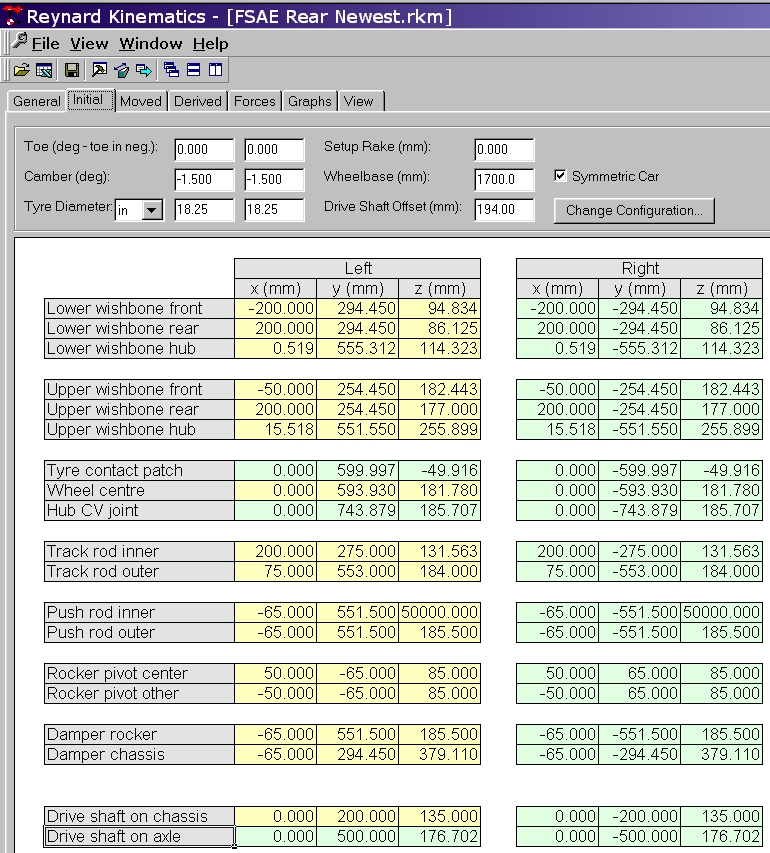
Figure 40. Coordinates for the rear suspension system.
Vehicle Dynamics Calculations Spreadsheet
Figure 41. Spreadsheet showing the calculation of vehicle dynamics parameters.
Brake System Calculations Spreadsheet
Figure 42. Spreadsheet showing calculations of brake system parameters.
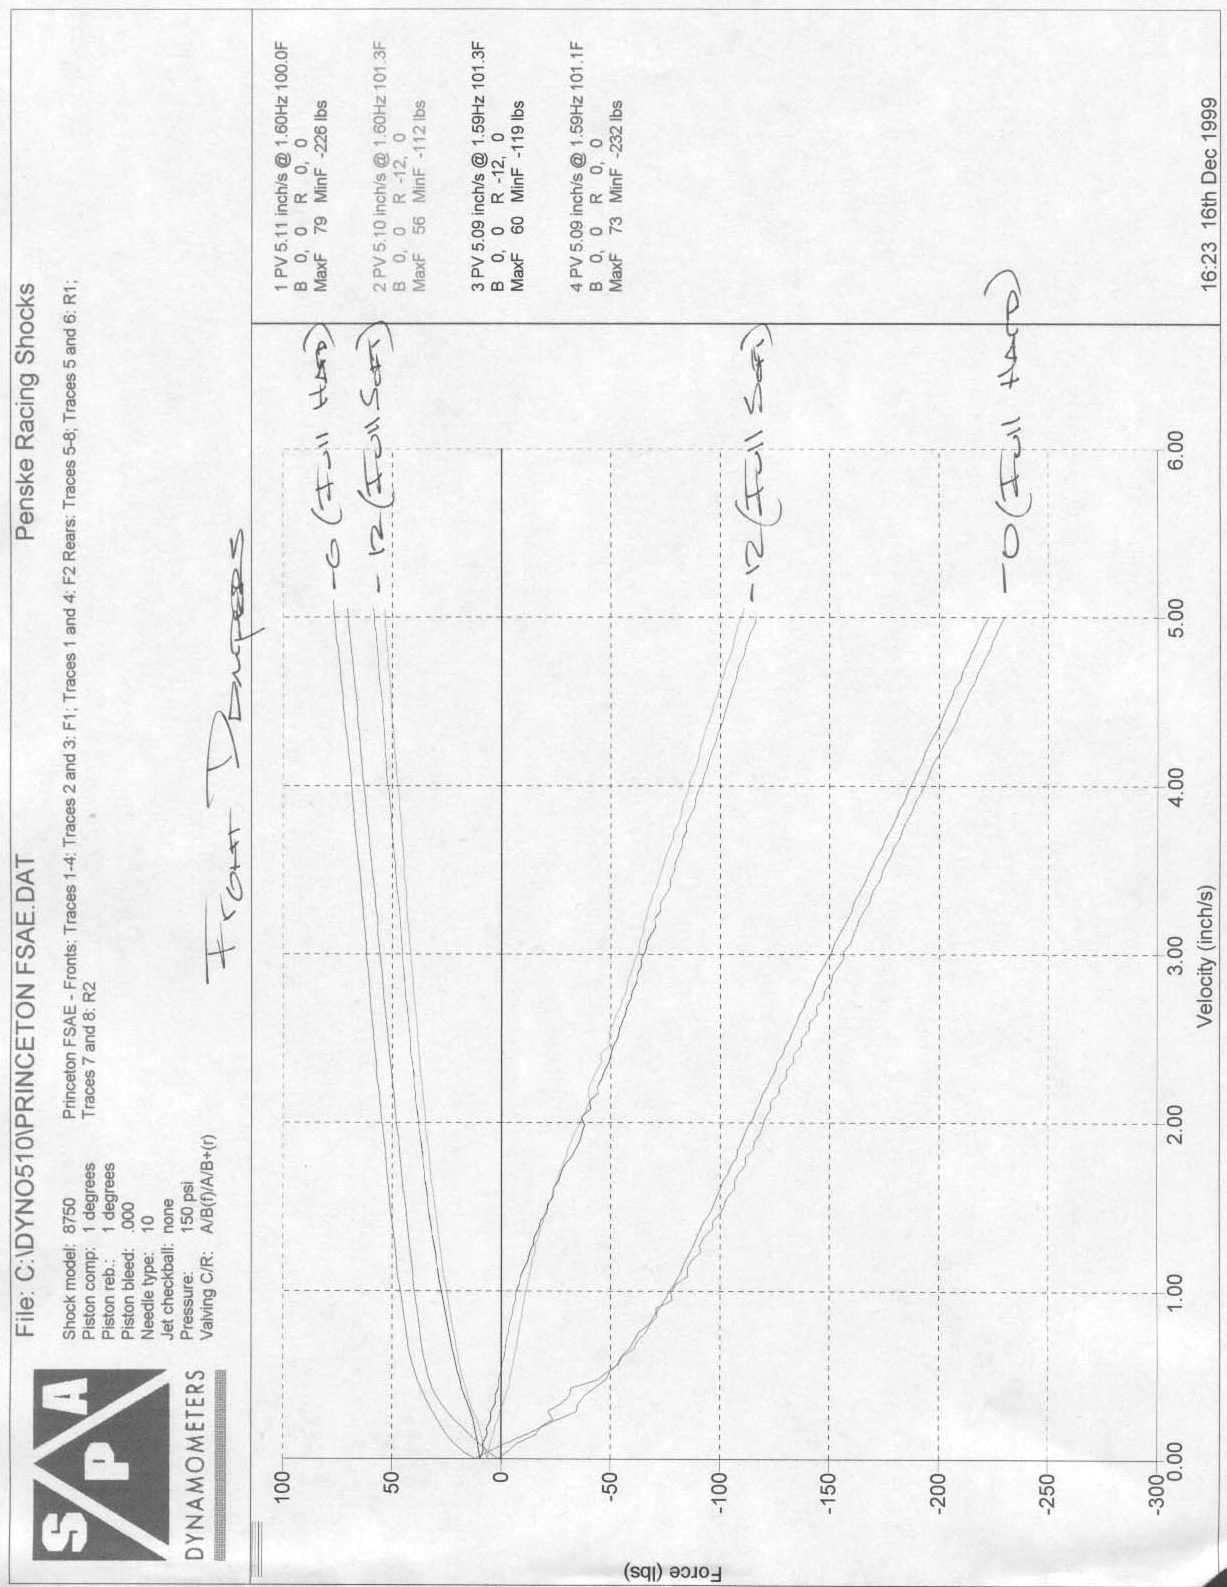
Figure 43. Front damper dyno plot.
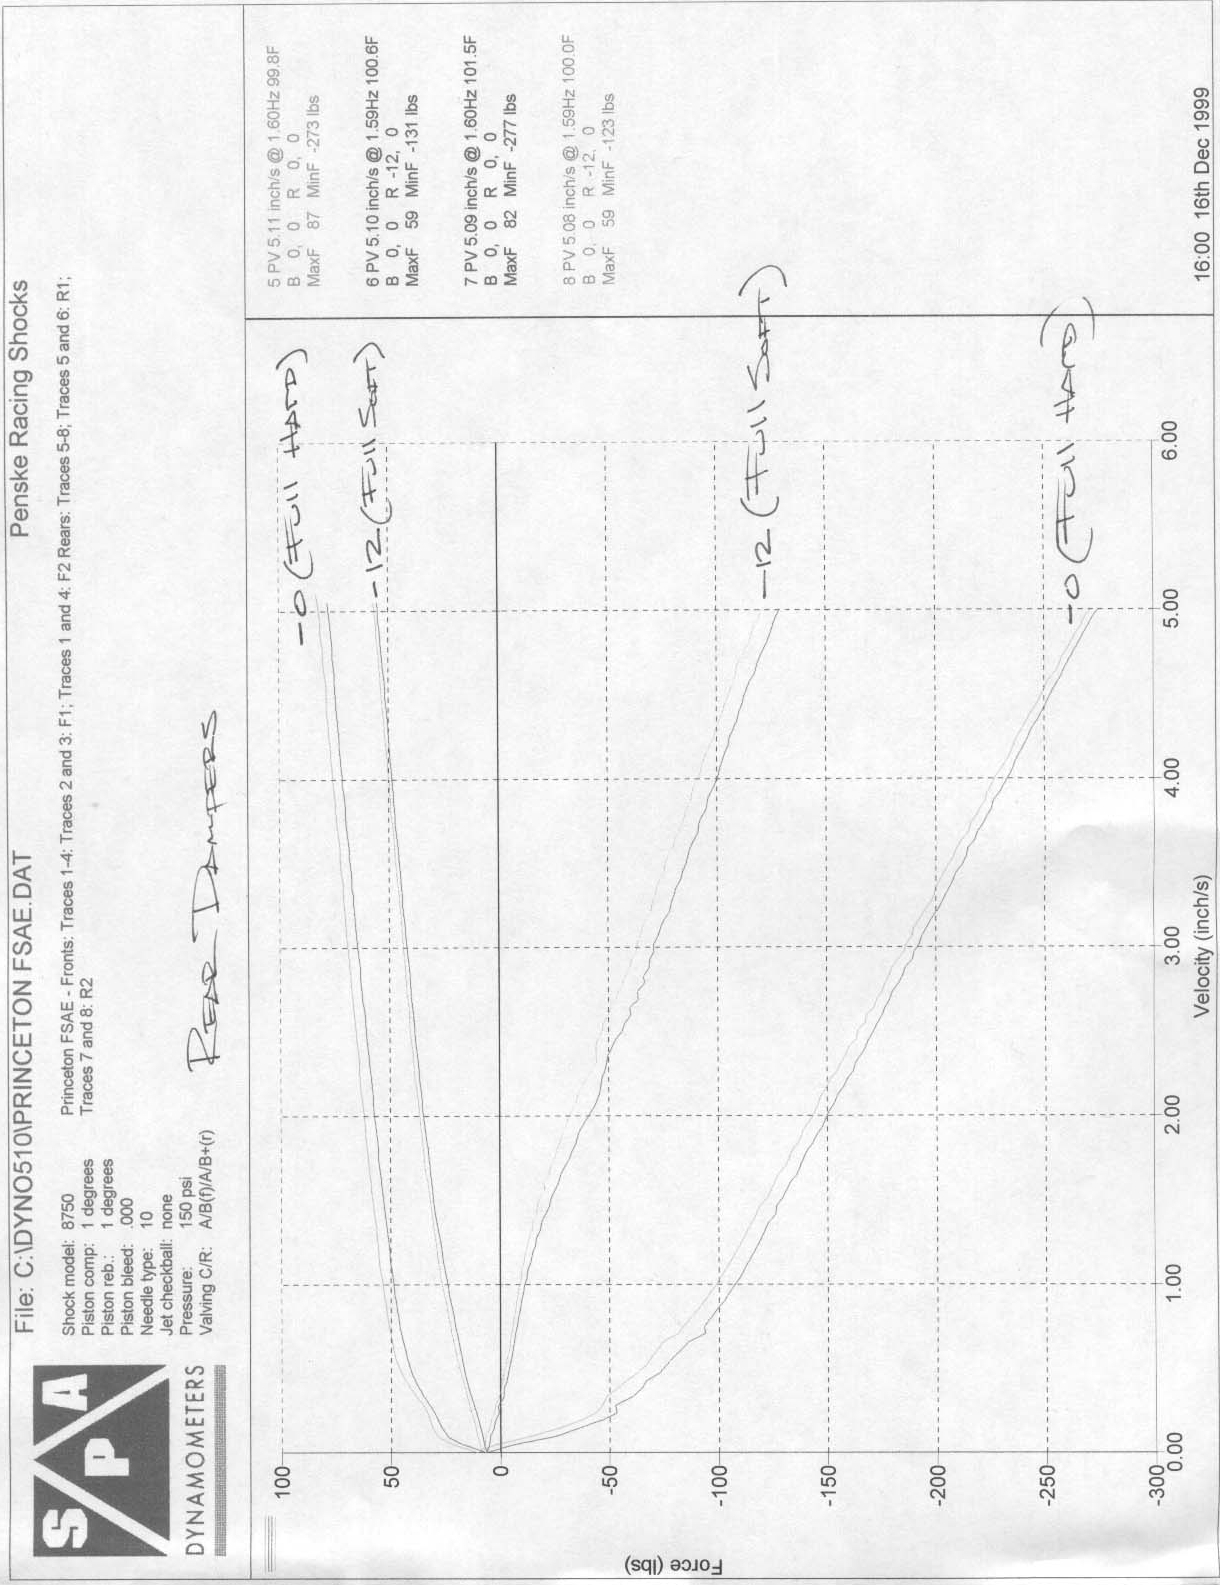
Figure 44. Rear damper dyno plot.
Figure 45. Front suspension A-arm dimensions.
Figure 46. Rear suspension A-arm dimensions.