*Suspension Analysis*
![]()
Note: Text that's highlighted in yellow is just to remind me of areas that are incomplete.
The analysis on this page is being redone and will be updated soon. Please take a look at "The High Performance, High Payload Driving School Car" on the projects page.
This page provides the analytical background to my suspension setup that is detailed on the suspension upgrade page.
Using theory learned on my own for creating Princeton's Formula SAE car and also from what I learned at Stanford's vehicle dynamics class, I have done some steady-state analysis of my E36 3 series using Matlab scripts. Results are shown below. Feel free to email me. Thanks to Chris Gerdes for clarifying the theory and setting the inspiration for this analysis. Most of the script started from a homework assignment.
1. The model
The Matlab script takes vehicle parameters such as vehicle mass, center of gravity location, weight distribution, track widths, roll center heights, etc. and determines a roll angle for a range of lateral accelerations simulating steady-state cornering. Knowing the spring rates and anti-roll bar rates, each axle's lateral weight transfer can be calculated. The normal and lateral loads on each wheel are then sent to a script that generates a slip angle for each axle based on tire parameters. The front and rear slip angles give a measure of the car's understeer gradient.
2. The measurements
I have made my best effort to determine the measurable parameters for the car. The data are shown below.
| Parameter | Measurement/Data | Comments |
| Mass | 1412 kg | Weighed on scales with 150 lb driver ballast and about 3/4 fuel tank. |
| Front/rear weight distribution | 48/52 | Determined from weighing. |
| Wheelbase | 2.69 m | Measured. This is about 1 cm less than the standard E36 wheelbase due my upper strut mount. |
| Front track width | 1.430 m | BMW data, corrected for wheel offset and wheel spacers. |
| Rear track width | 1.423 m | BMW data, corrected for wheel offset. |
| Center of gravity height | 0.5 m | An estimate that will be verified soon. |
| Front roll center height | 0.05 m | Derived from measured kinematics data. This is assumed to remain constant with roll. In reality, it will shift both vertically and laterally. I hope to determine if this is a major source of error. Most likely it is not (especially with stiffer springs). |
| Rear roll center height | 0.27 m | Derived from measured kinematics data, using only the two lateral links that dominate the front view geometry. The rear roll center height is assumed to remain constant with roll. A computer model of the rear suspension was generated, and movement was confirmed to be very small. |
| Overall steering ratio | 16.8:1 | BMW data. The actual ratio may be slightly different due to my modified steering geometry, but this does not affect the qualitative results of the analysis. |
| Front spring motion ratio | 1.3:1 | Here are the graphs for the front and rear suspension motion ratios measured by Ron Katona and me. |
| Rear spring motion ratio | 1.7:1 | Here are the graphs for the front and rear suspension motion ratios measured independently by Ron Katona and me. Our values for the rear suspension differed,so an average has been used for the analysis until another set of measurements is obtained. |
| Front spring rate |
90 lb/in (stock) 400 lb/in (PSS-9) |
The stock spring rate is an estimate based on other people's measurements. The PSS-9 spring rate is published Bilstein data. The front spring motion ratio is used to convert these rates to axle roll rates. |
| Rear spring rate |
300 lb/in (stock) 425 lb/in (PSS-9) |
The stock spring rate is an estimate based on other people's measurements. The PSS-9 spring rate is published Bilstein data. The rear spring motion ratio is used to convert these rates to axle roll rates. |
| Front anti-roll bar diameter |
26.0 mm (stock) 0.0 mm (no bar) 22.5 mm (Z3 bar) |
Two different anti-roll bar sizes were installed and analyzed, as well as without a front bar. Other dimensions were measured to convert these diameters into axle roll rates. Due to the kinks in the front anti-roll bars, the axle roll rates are only approximate. I will do a closer analysis here at a later date. |
| Rear anti-roll bar diameter |
18.0 mm (stock) 0.0 mm (no bar) |
The rear anti-roll bar was removed for one of the tests and analyses. Other dimensions were measured to convert these diameters into axle roll rates. |
| Front camber | -2.0 degrees | Measured on alignment rack. An estimate for camber change with roll has been incorporated, but the effects are very minor. |
| Rear camber | -1.60 degrees | Measured on alignment rack. An estimate for camber change with roll has been incorporated, but the effects are very minor. I may post this data at a later date. |
| Caster (L/R) | 6.30/6.40 degrees | This was not included in the analysis but may incorporated in the future. |
| Tire data | This is the largest source of error for this model. The script requires 12 tire parameters in addition to camber angle to map wheel normal and lateral loads to slip angles. Tire manufacturers do not readily release this data, so the parameters used are for a "generic tire" at best. However, since all the analyses are done on the same tire model, a qualitative comparison between suspension setups is possible. |
I noticed an oversight in my analysis. The stock suspension setup analysis is not quite right as I used the center of gravity height, roll center heights and alignment settings of my newer setup. This means that the graphs actually show the stock suspension performing relatively better than it would probably do. I will correct this soon.
3. Summary of results
The following graphs show 5 different suspension setups. The subjective handling comments on each of these setups is given on the suspension upgrade page.
The first
setup is with the stock sport suspension springs and anti-roll bars.
The second setup is with the Bilstein PSS-9 kit retaining the original anti-roll
bars.
The third setup has the front anti-roll bar removed.
The fourth setup has both anti-roll bars removed.
The fifth setup has the original rear anti-roll bar removed and a smaller front
anti-roll bar installed.
There is a lot of information that I could discuss here, but I will only give the basics for now unless I get requested otherwise.
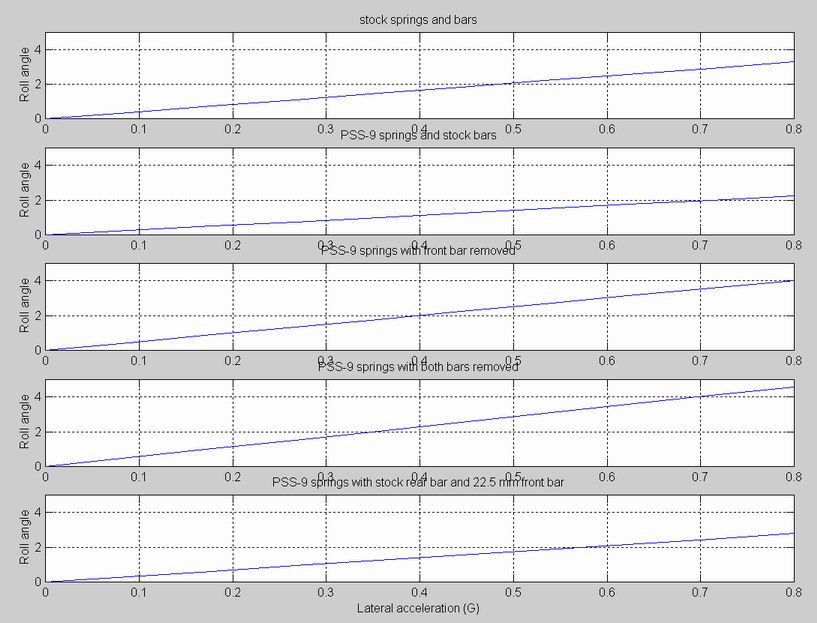
Roll angle:
These graphs will change slightly when the actual and measured center of gravity
height is used instead of the 0.5 m estimate. Nevertheless, it is clear that the
stiffer Bilstein PSS-9 setup reduces roll. Removing one or more anti-roll bars
increase roll again. The fifth setup with the changed front bar produces a roll
gradient roughly in between the first setup and the second setup.
Load transfer: There's nothing too exciting here other than that the front axle always transfers the most load, a design decision that guarantees limit understeer. How much roll each axle is resisting is given below, for each of the setups.
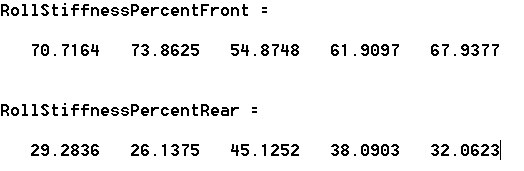
The interesting point here is that despite the huge front/rear spring rate change between the first and second setups (from stock springs to Bilstein coilovers), the roll stiffness ratio only changed by about 3%. This is because the dominant contributor to the overall roll stiffness is the front anti-roll bar, so even though the front spring rate changed a lot, the roll stiffness distribution did not change too much.
hese following graphs show how much load is transferred on the front axle vs. the rear axle for the suspension setups. At 0.8 G, we can see that 100% load transfer is imminent for the front axle, which would suggest front inside wheel lift off which we see in some situations. Again, a revised center of gravity measurement and more accurate spring and anti-roll bar stiffnesses will changes these graphs.
![]()
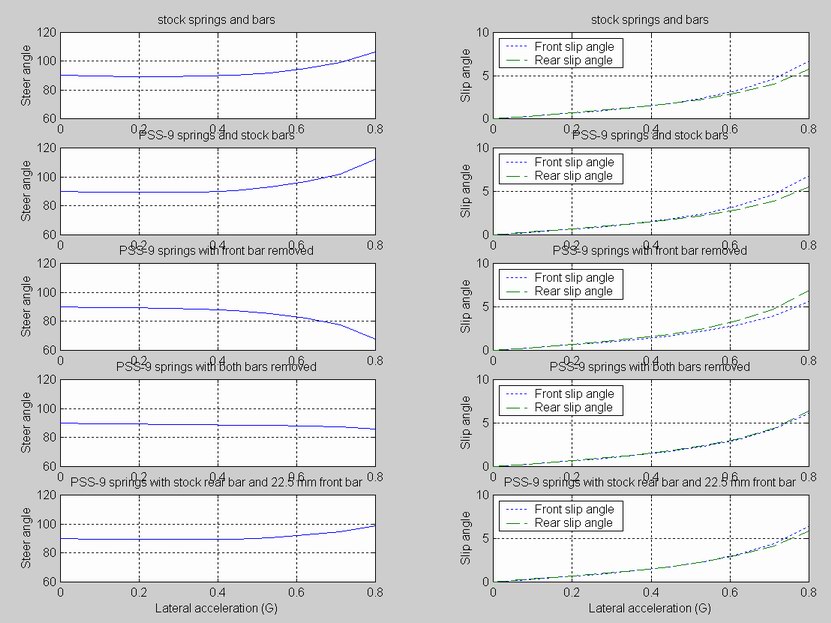
Understeer gradient and slip angles: The left column of graphs show the steer angle vs. lateral acceleration. It is scaled to give a 90 degree steering wheel angle at low lateral accelerations as a reference. A rising line suggests understeer, while a falling line suggests oversteer. For example, with the first setup, at 0.8 G, the steering wheel would need to be turned from 90 degrees to almost 110 degrees to negotiate the turn (understeer). The first setup understeers, the second setup understeers more, which is what brought me to explore the last 3 setups. Once the front bar is removed, the car assumes an oversteering attitude which was obvious in the driving evaluation. Installing a smaller front anti-roll bar removed the oversteer and biased the car towards a very slight understeer. The graphs on the right show the same story in a different light, by displaying different front and rear slip angles. A larger front slip angle leads to understeer, while a larger rear slip angle leads to oversteer.